1. Introduce
1.1. Technology solutions
The temperature - humidity monitoring device is designed and manufactured by DHT Equipment Technology Joint Stock Company. The goal of the device is to use the newest technology to monitor the environment temperature and humidity, store monitoring data records and give warnings if there is a change in temperature - humidity higher than the set threshold.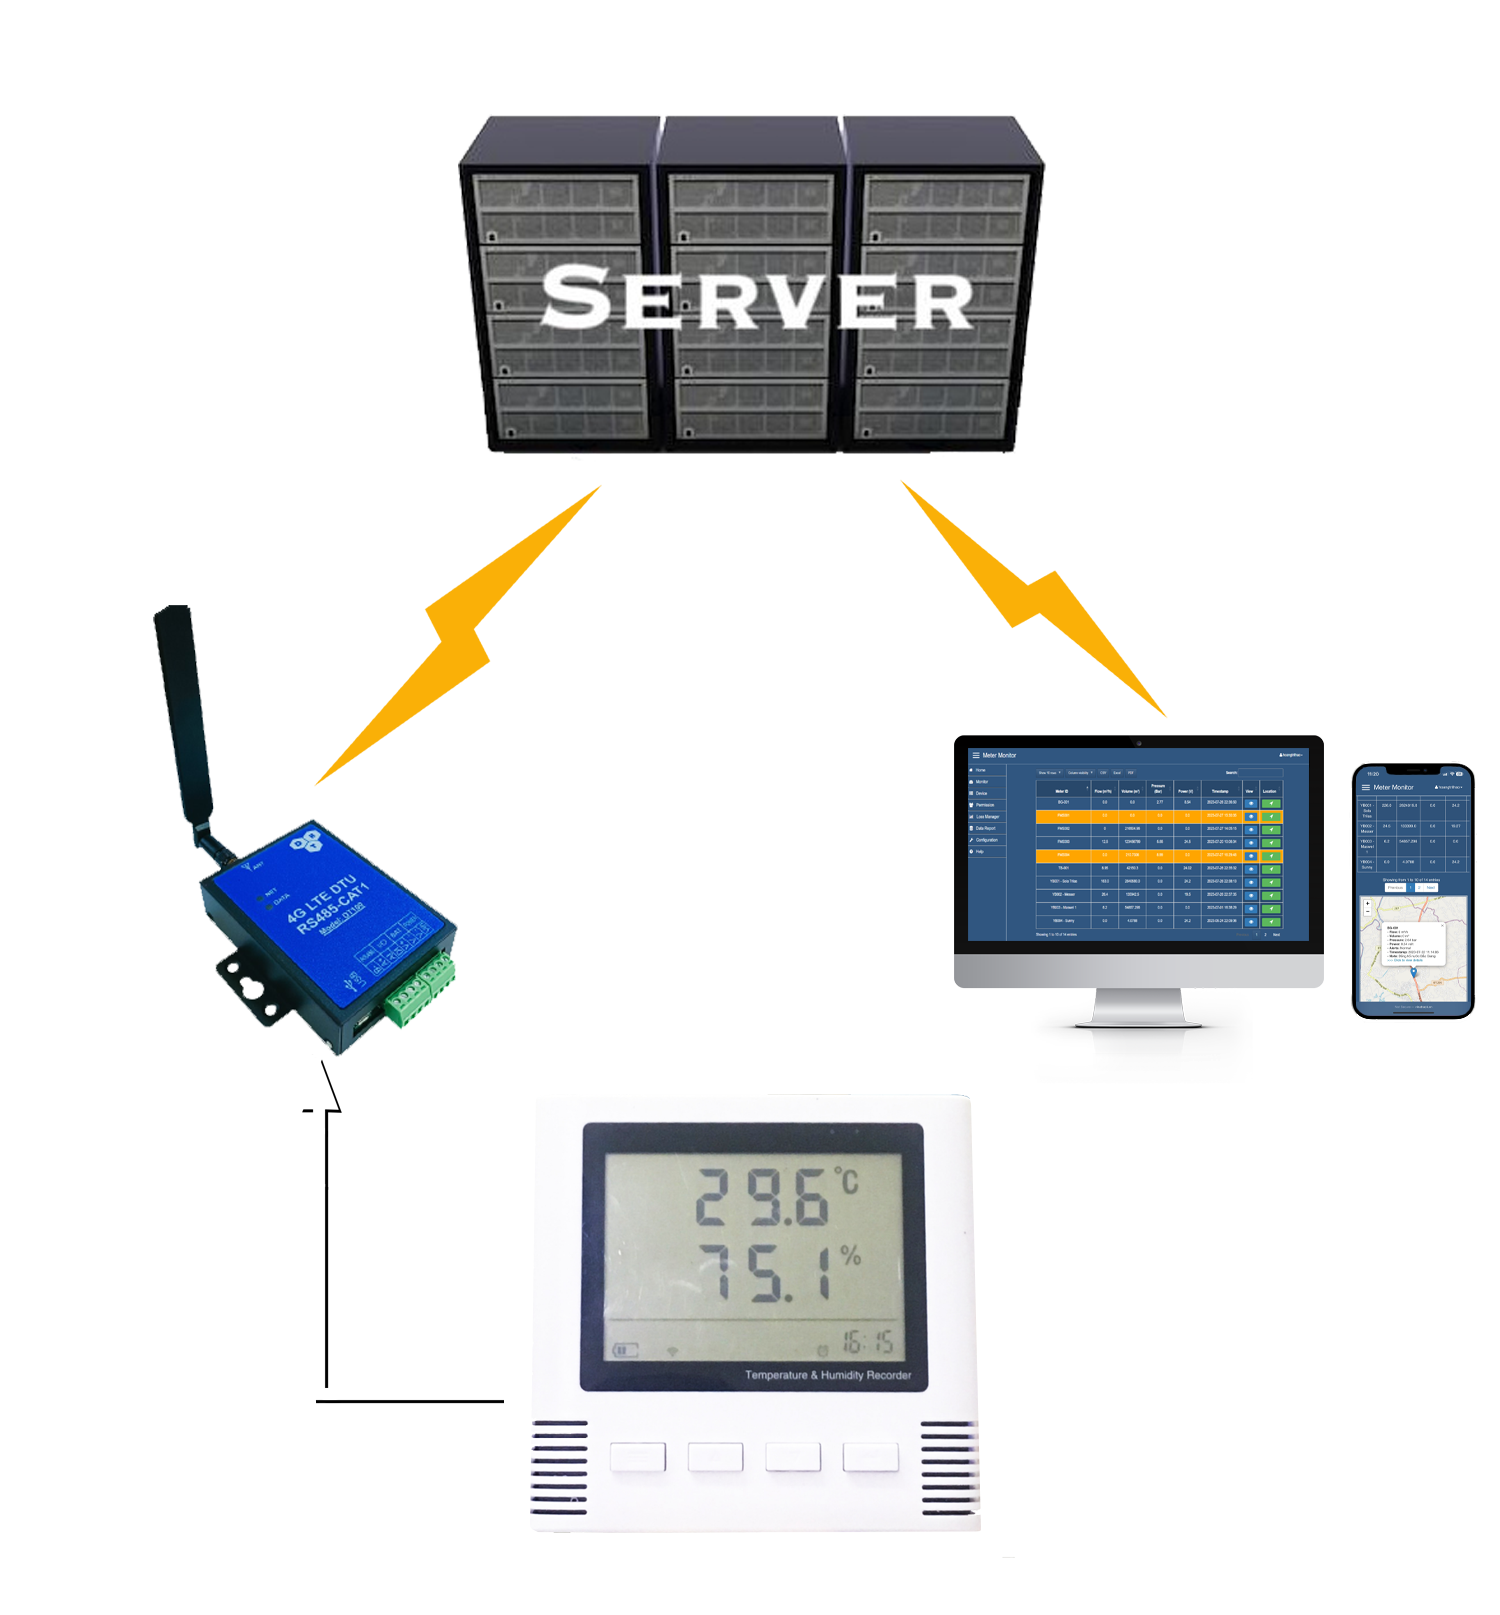
Figure 1.1. Remote monitoring and data storage solution.
The temperature - humidity monitoring device uses the peripheral to read the sensor data and send it to the server, the data is processed and saved in the database. The website interface and mobile application allow users to monitor the status of sensors in real time, review data and receive alerts when something goes wrong.
1.2. Basic interface
The interface of the system to manage temperature and humidity monitoring devices includes the following items:- Home.
- Monitoring: Real-time display of the device's current status and parameters.
- Device: Manage device, allow to edit the device's information.
- Permissions: Manage device permissions for other user accounts.
- History: Save device data history (1 data record every 30 minutes).
- Configuration: Manage device configuration, allowing to set device specifications.
- Support: Guide to use the features of the temperature - humidity monitoring management system.
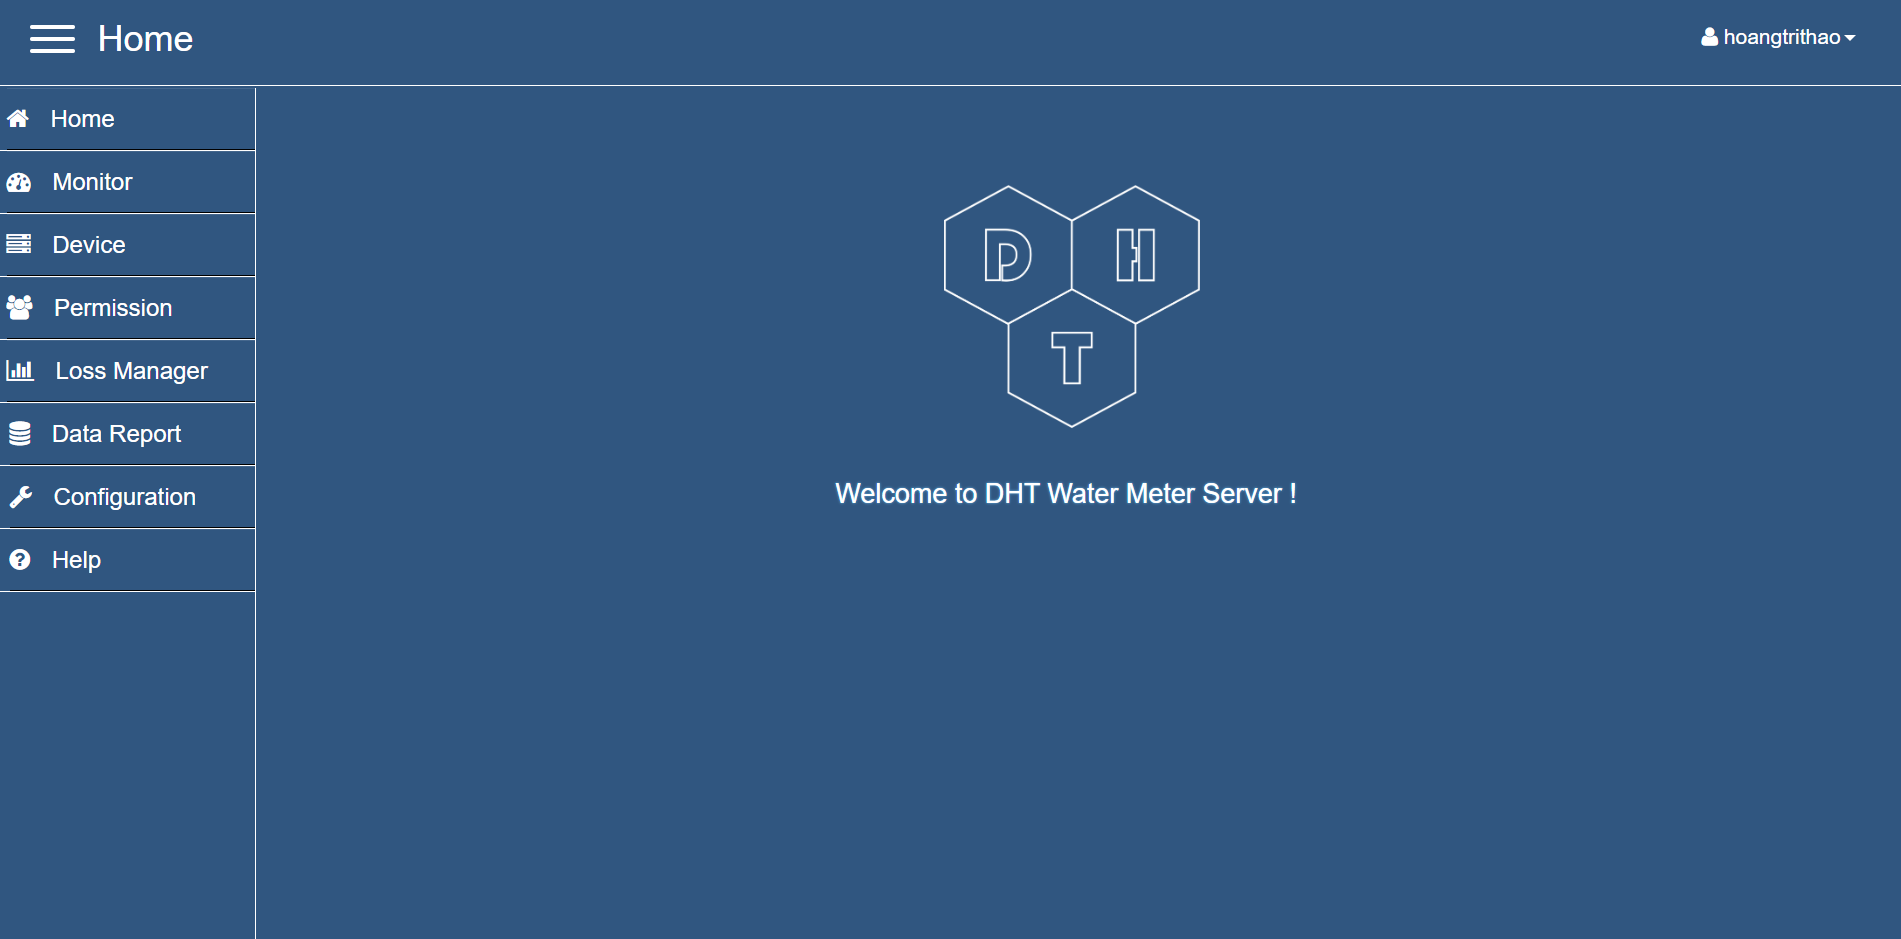
Figure 1.2. Basic interface.
2. Account
2.1. Login
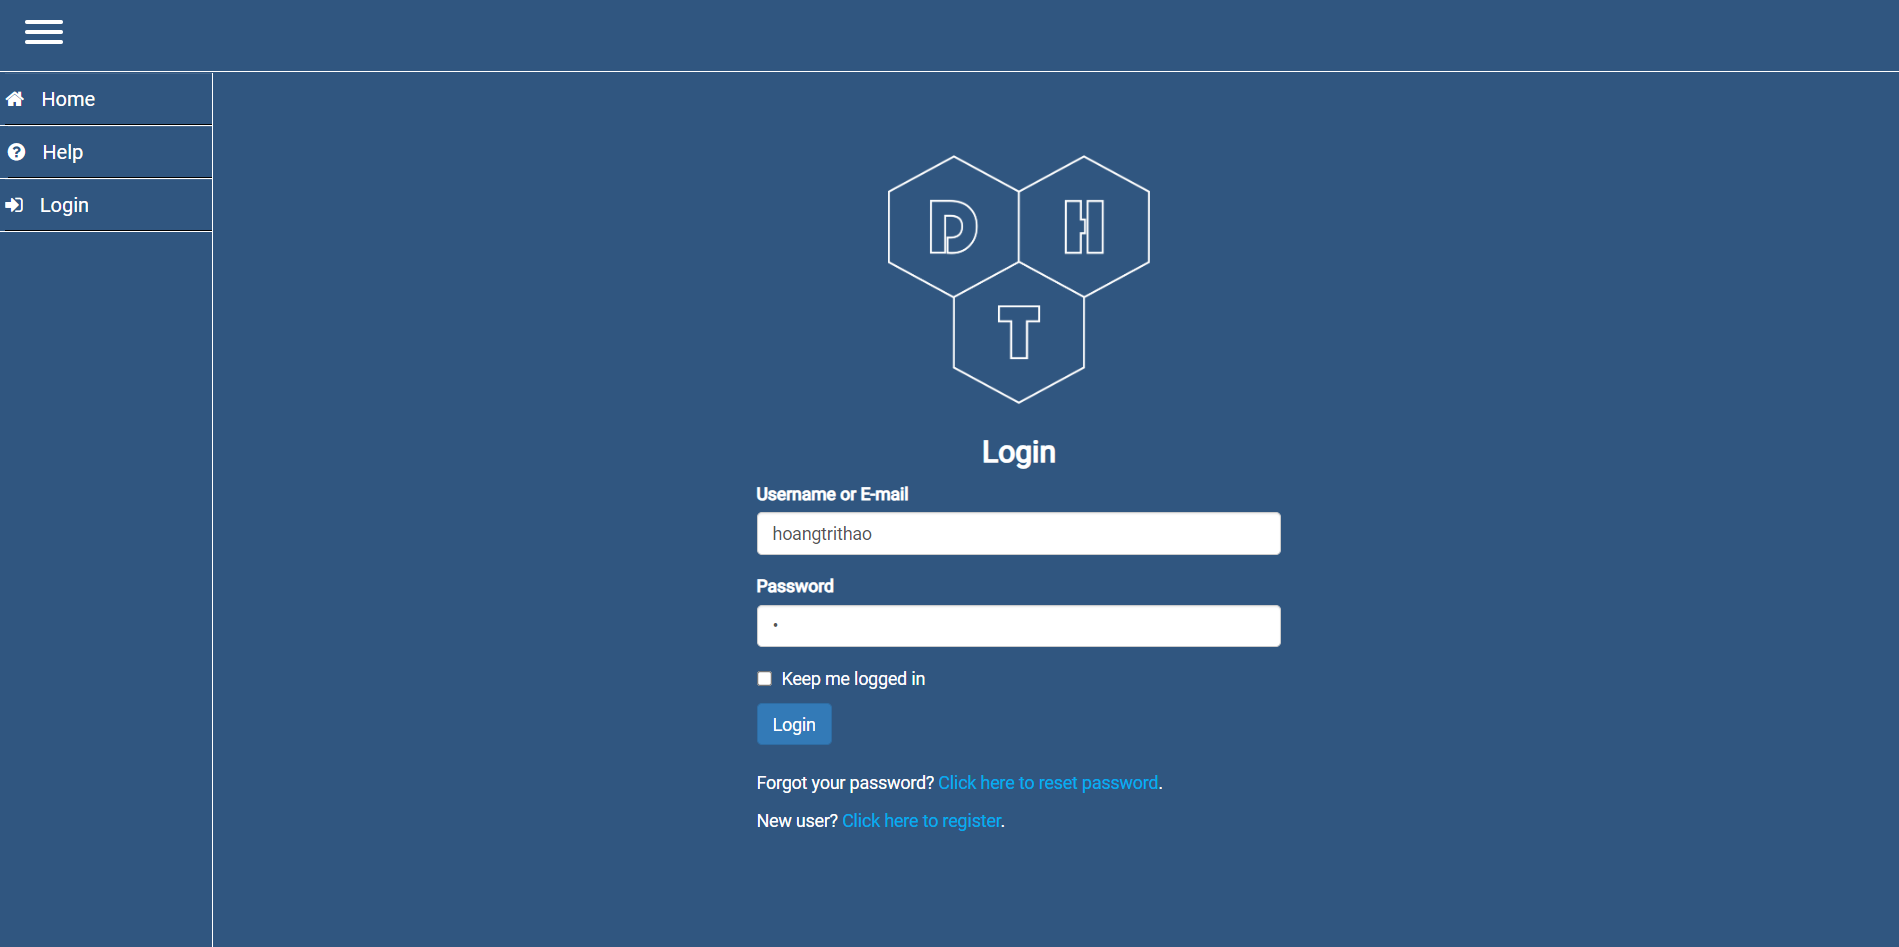
Figure 1.2. Login interface.
After accessing the link to the website, you need to log in to access the system. You can use a demo account to login, allowing to see the basic features (excluding management features) of the user.
Demo account:
- ID: demo
- Password: demo
2.2. Account register
To register an account, click on “Click here to register”. Here you enter all the information and press “Register”.
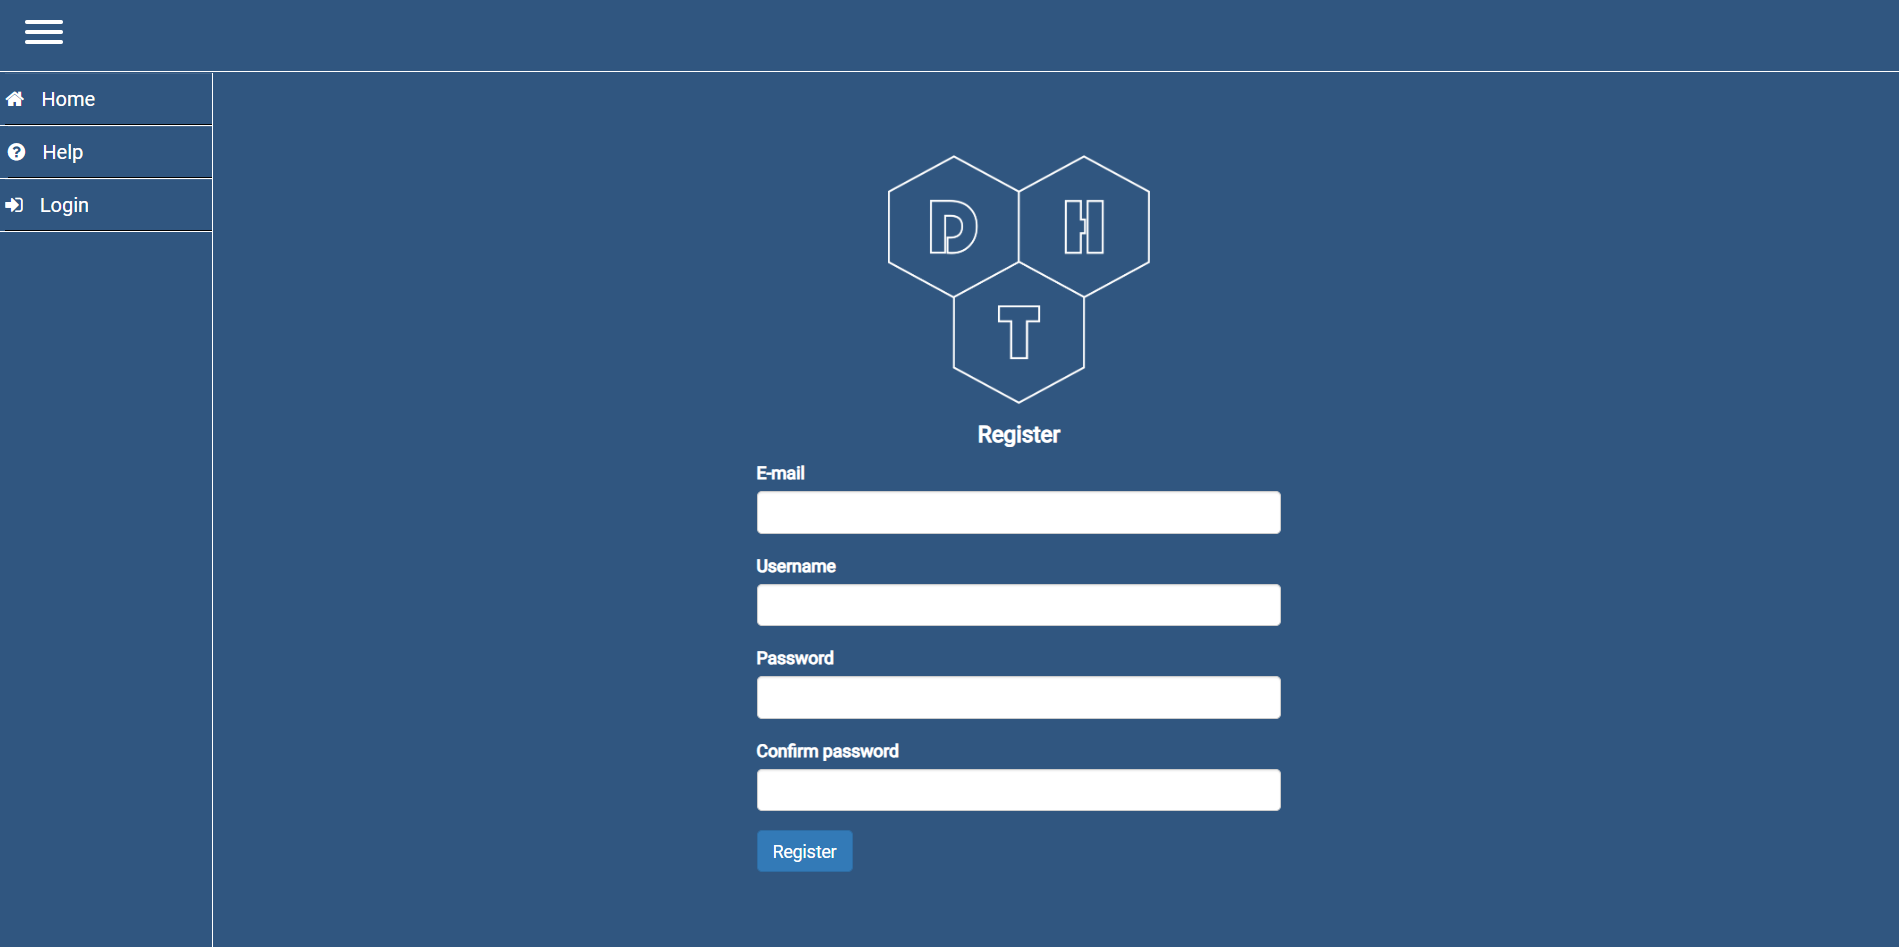
Figure 2.2. Account register.
The system will send you an e-mail confirming account registration (E-mail may be sent to the "Spam" folder. Then follow these steps to confirm the account:
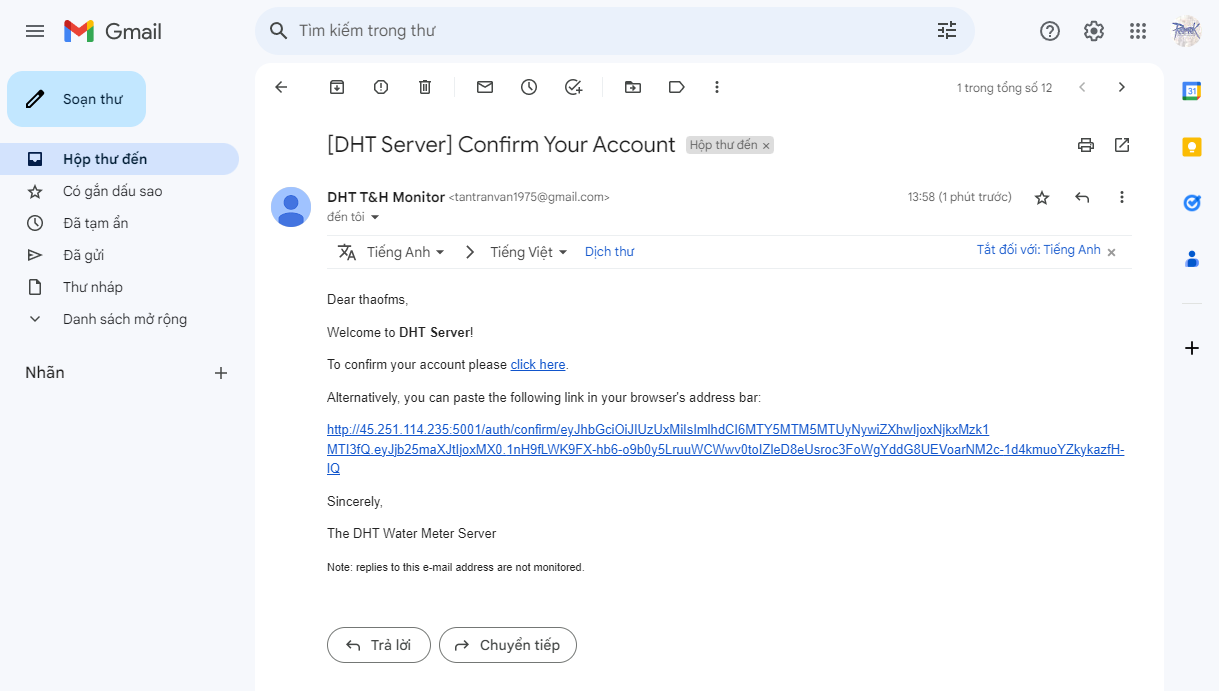
Figure 2.3. E-mail confirmation of account registration.
+ Step 1: Select "click here" to go to the account confirmation page.
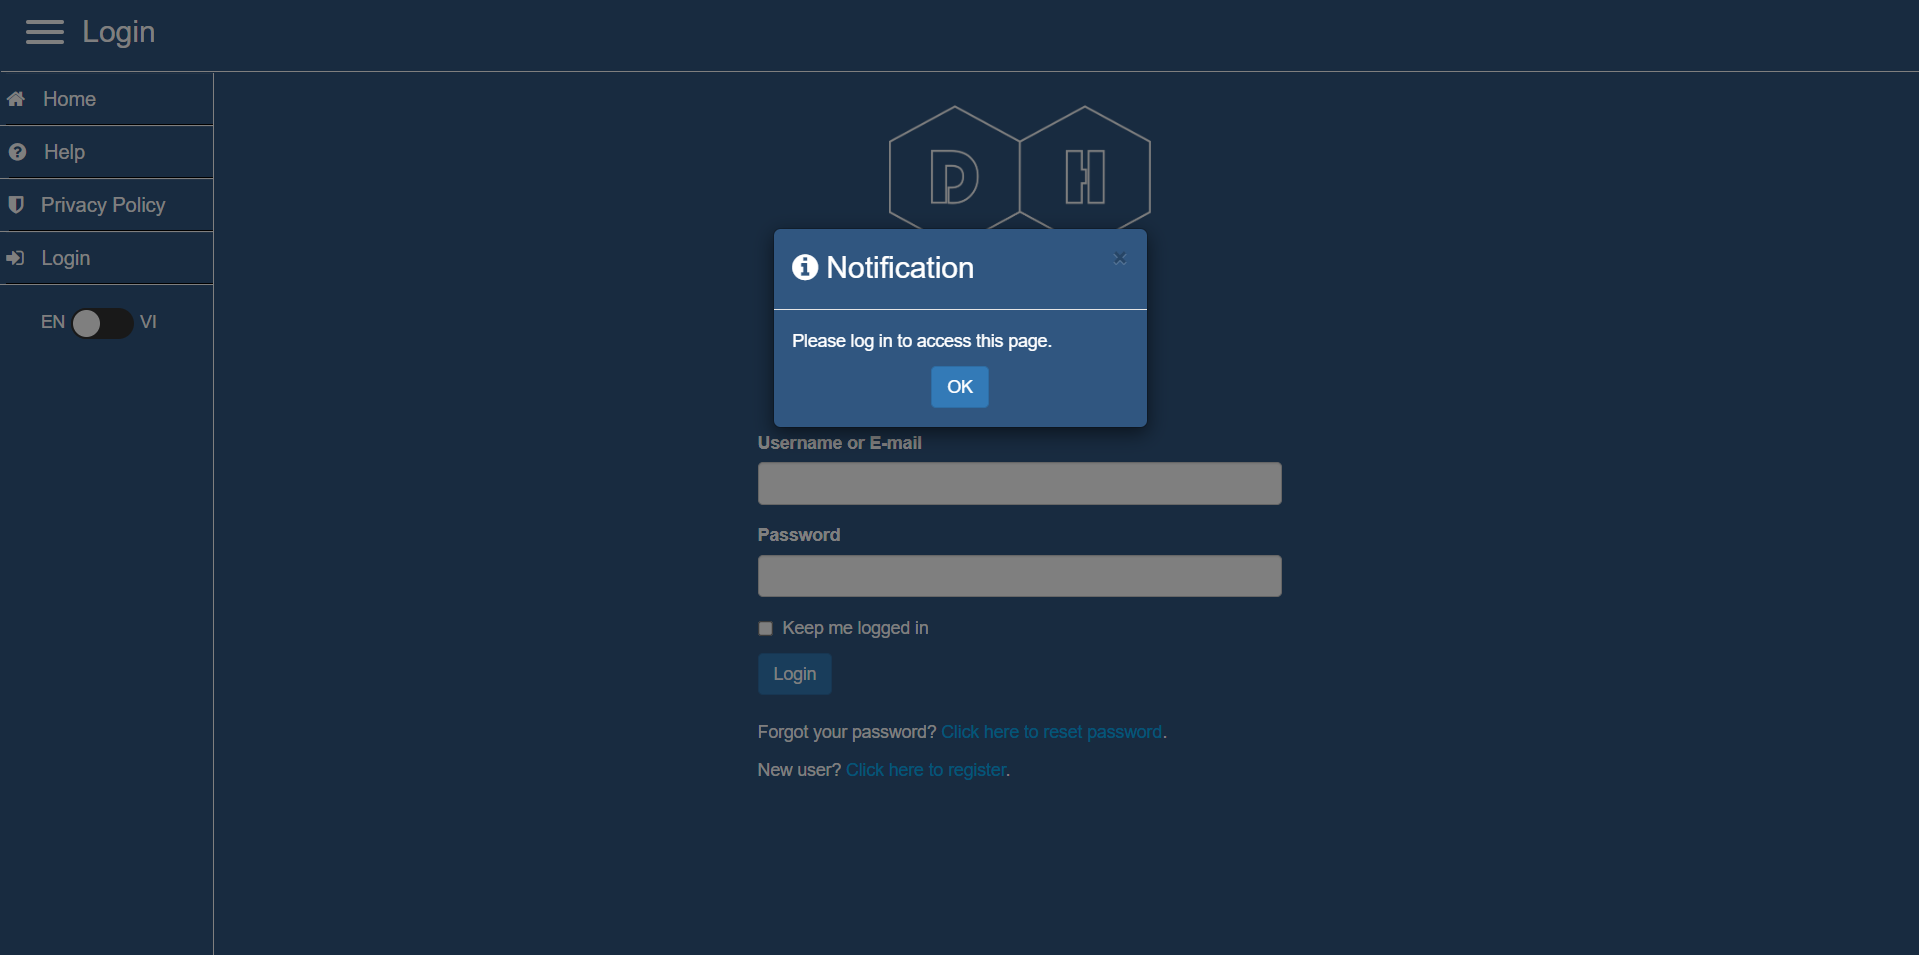
Figure 2.2.2. Login to confirm account.
+ Step 2: Enter the correct account and password registered.
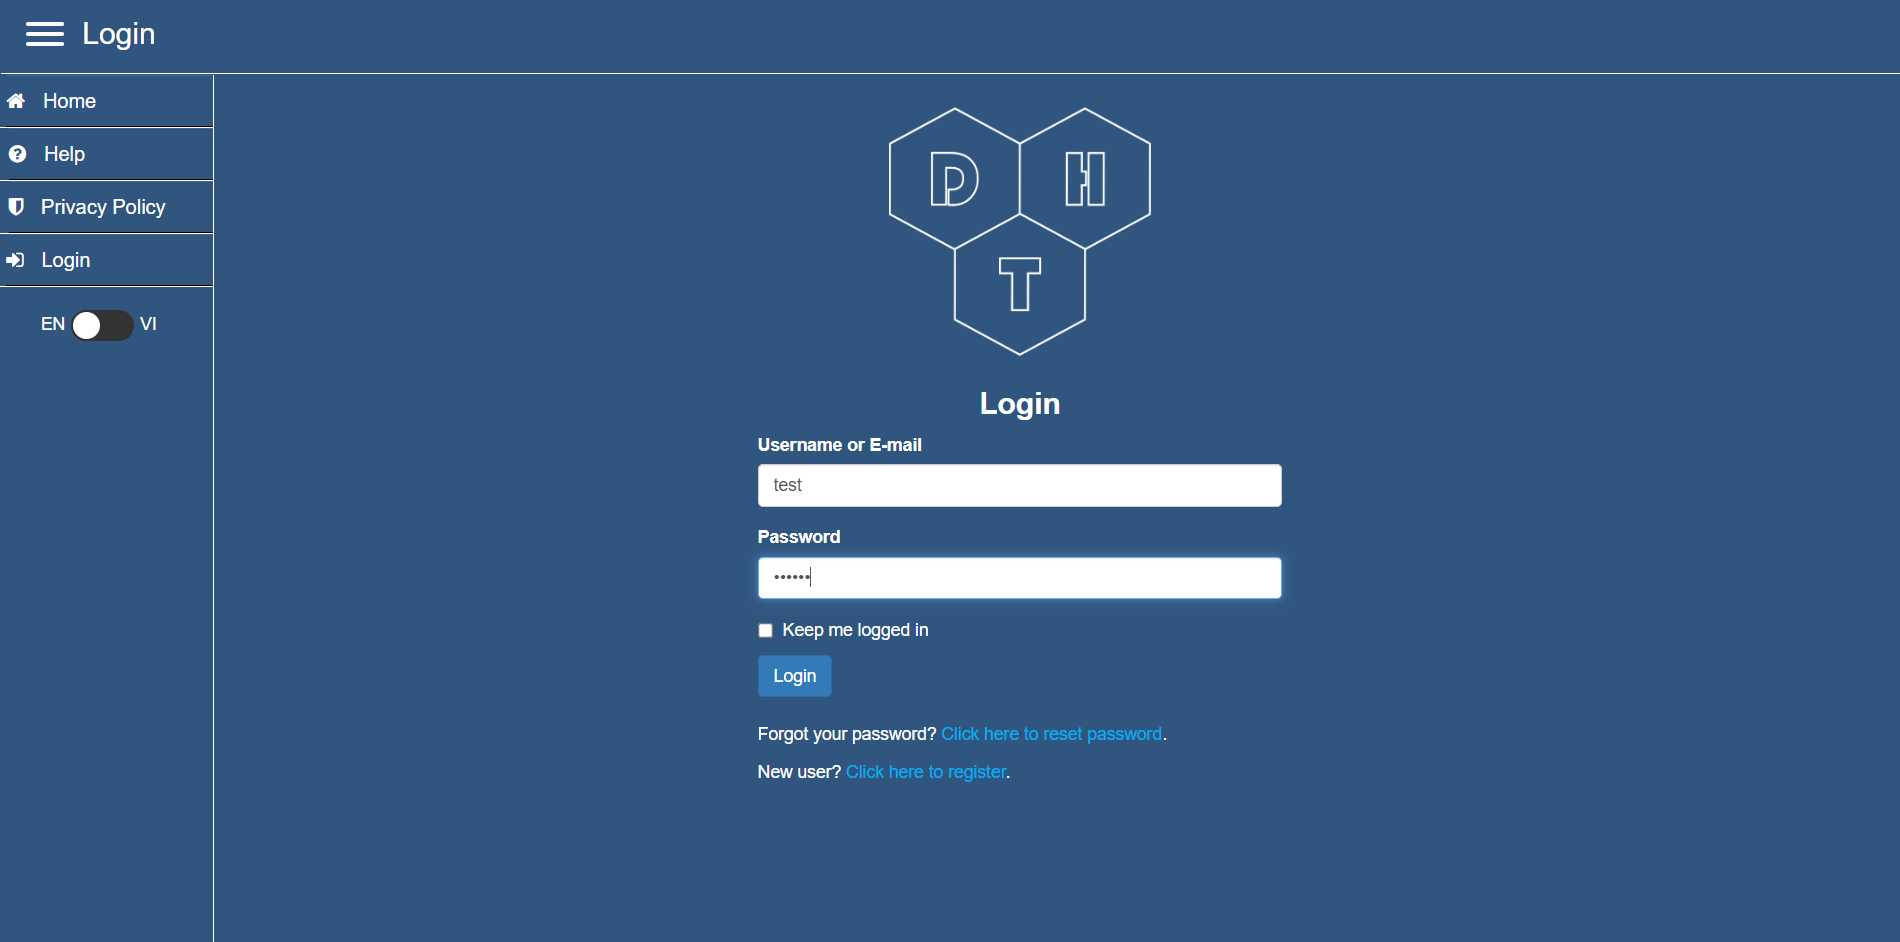
Figure 2.2.3. Enter the account and password.
+ Step 3: Click "Login" to login and you will receive a successful account confirmation message.
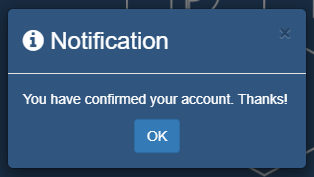
Figure 2.2.3. Account confirmation successful.
After confirming the e-mail, you can use that account to log in to the website.
2.3. Reset password
At the login interface, click “Click here to reset password”. You enter your registered e-mail address and press “Reset Password”.
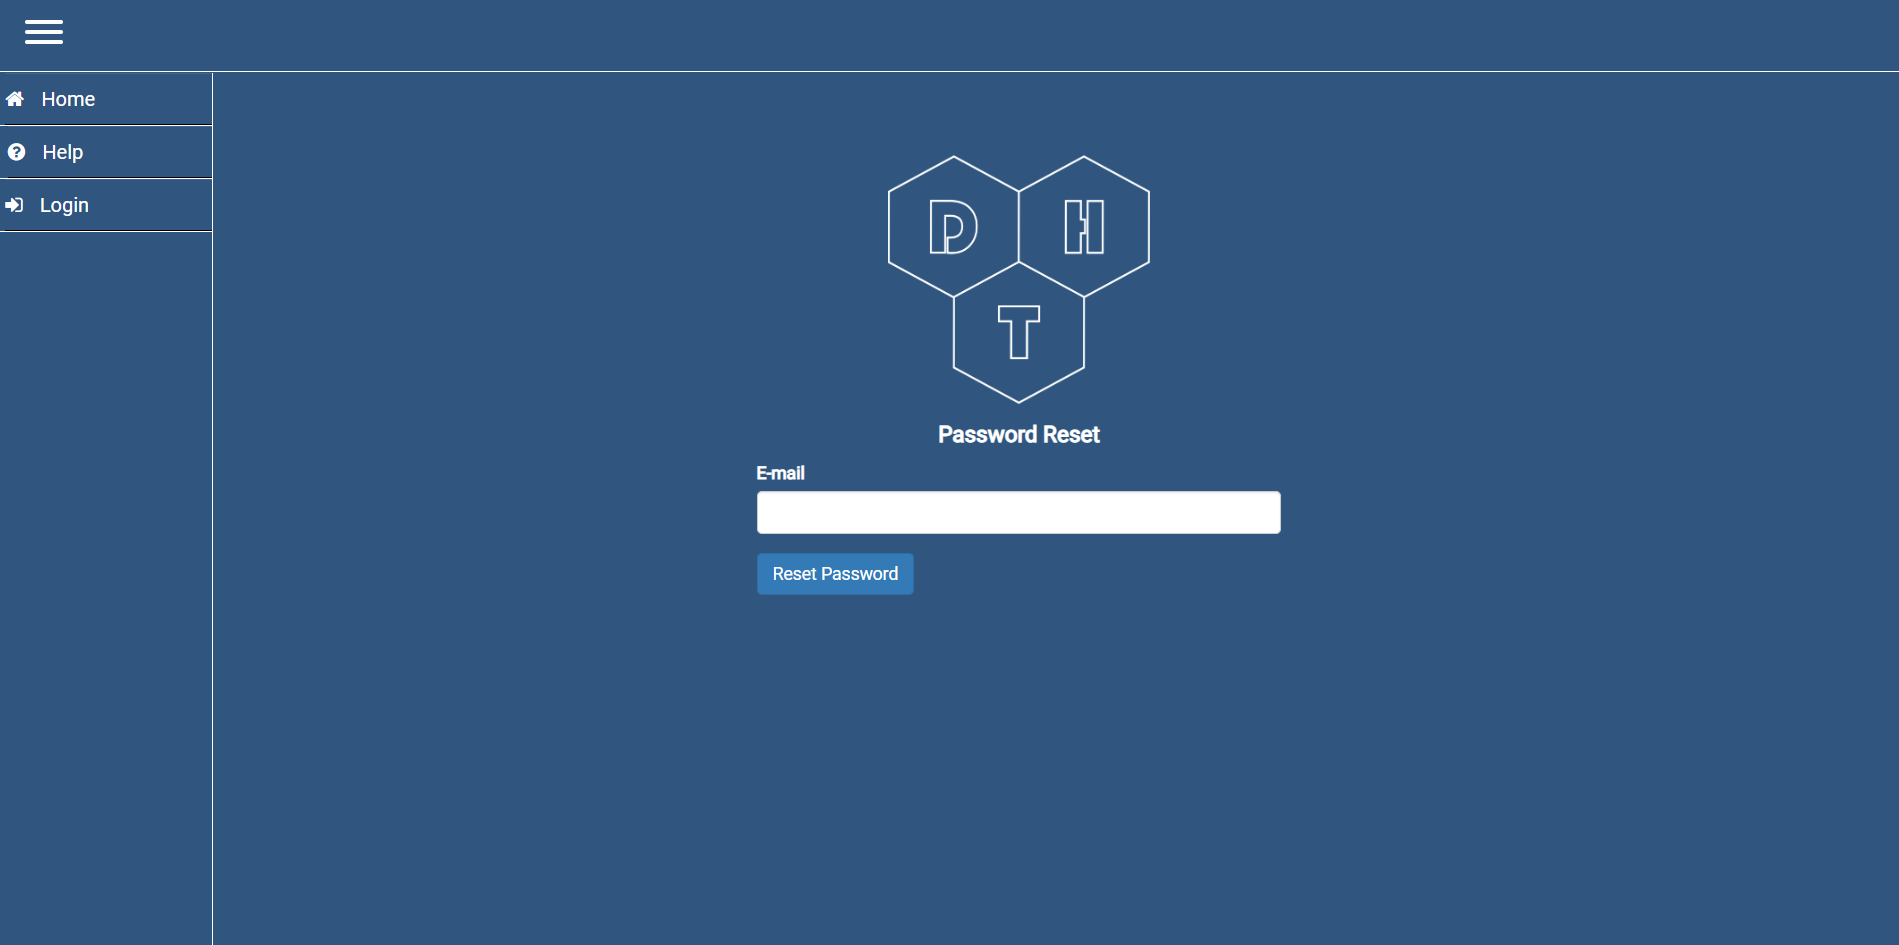
Figure 2.4. Reset password.
The system will send you an e-mail confirming the password reset. Here, you enter a new password and confirm.
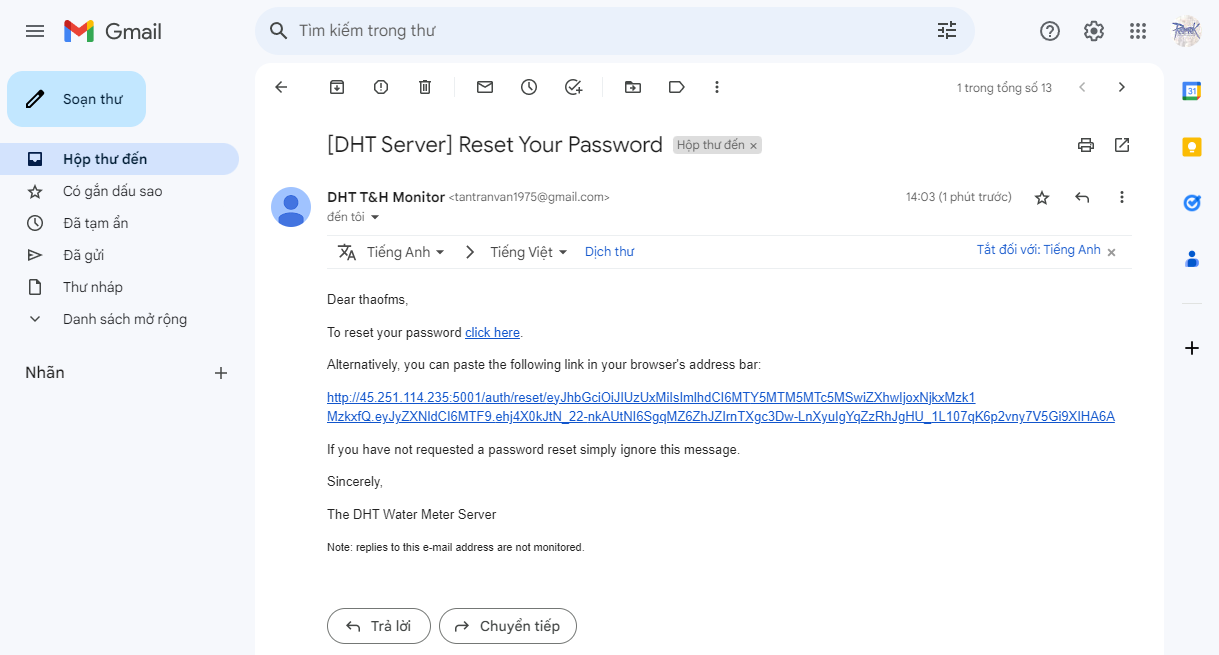
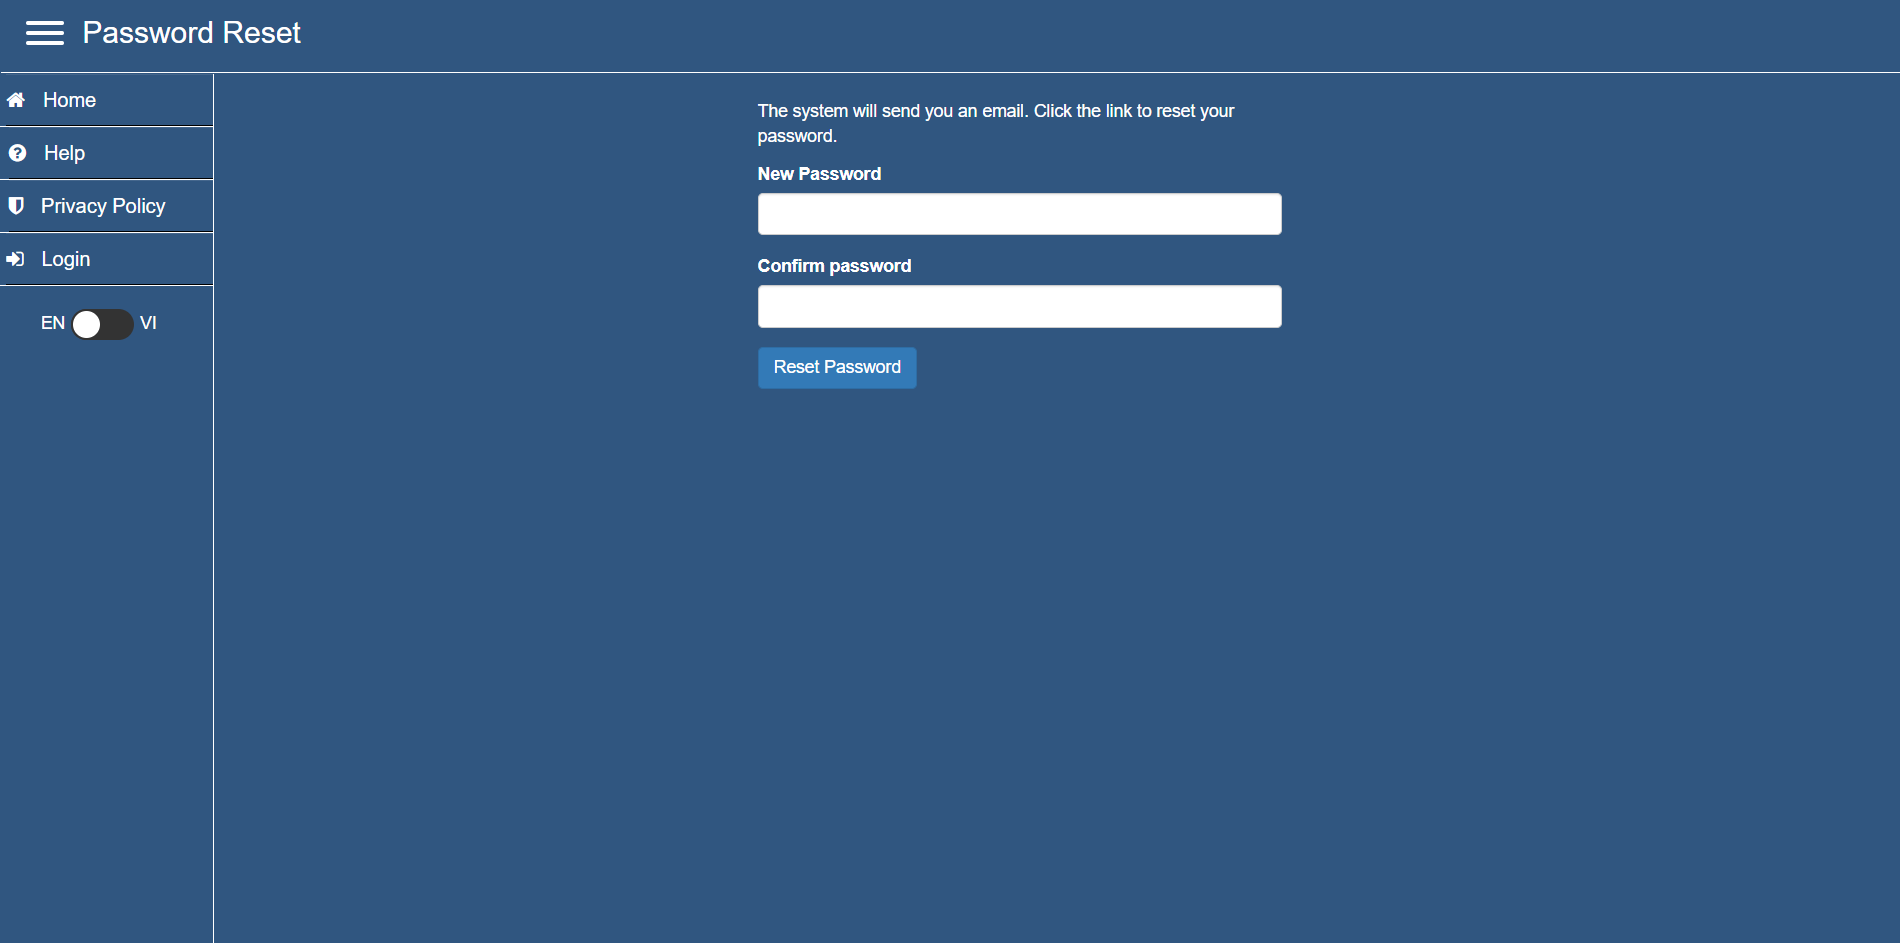
Figure 2.5. Password reset confirmation email.
2.3. Change e-mail
At the interface after successful login, click on the username and click “Change E-mail”.
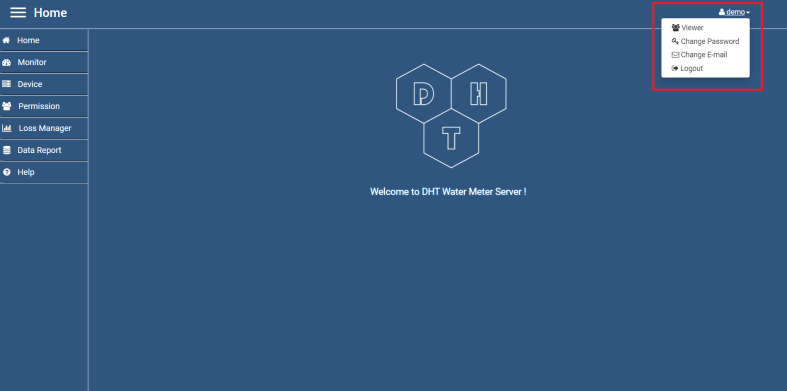
Figure 2.6. Change e-mail.
Then enter a new e-mail and click “Update E-mail Address”.
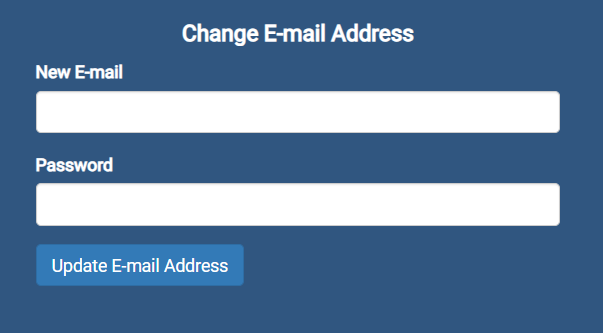
Figure 2.7. Enter a new e-mail address.
The system will send you a confirmation email to your new e-mail address. You check your e-mail and confirm the new e-mail address.
2.5. Change password
At the interface after successful login, click on the username and click “Change Password”.

Figure 2.8. Change password.
Enter the old and new passwords, then click “Update Password”.
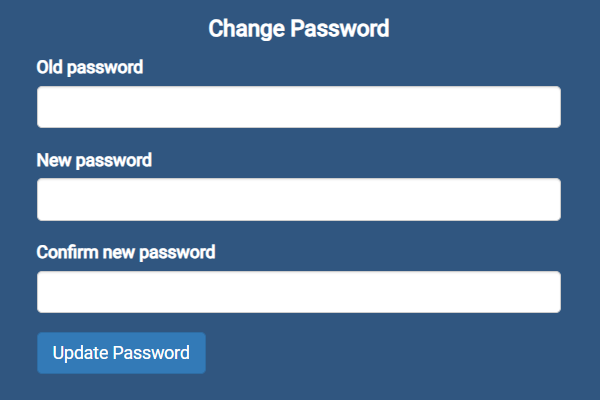
Figure 2.9. Enter new password.
3. Device monitoring
3.1. Monitoring parameters
The system monitors the following parameters in real-time:
- Temperature (unit: °C).
- Humidity (unit: %RH).
- Warning when there is a problem with the above parameters (when there is a problem, the indicator of the device on the monitoring board will show yellow).
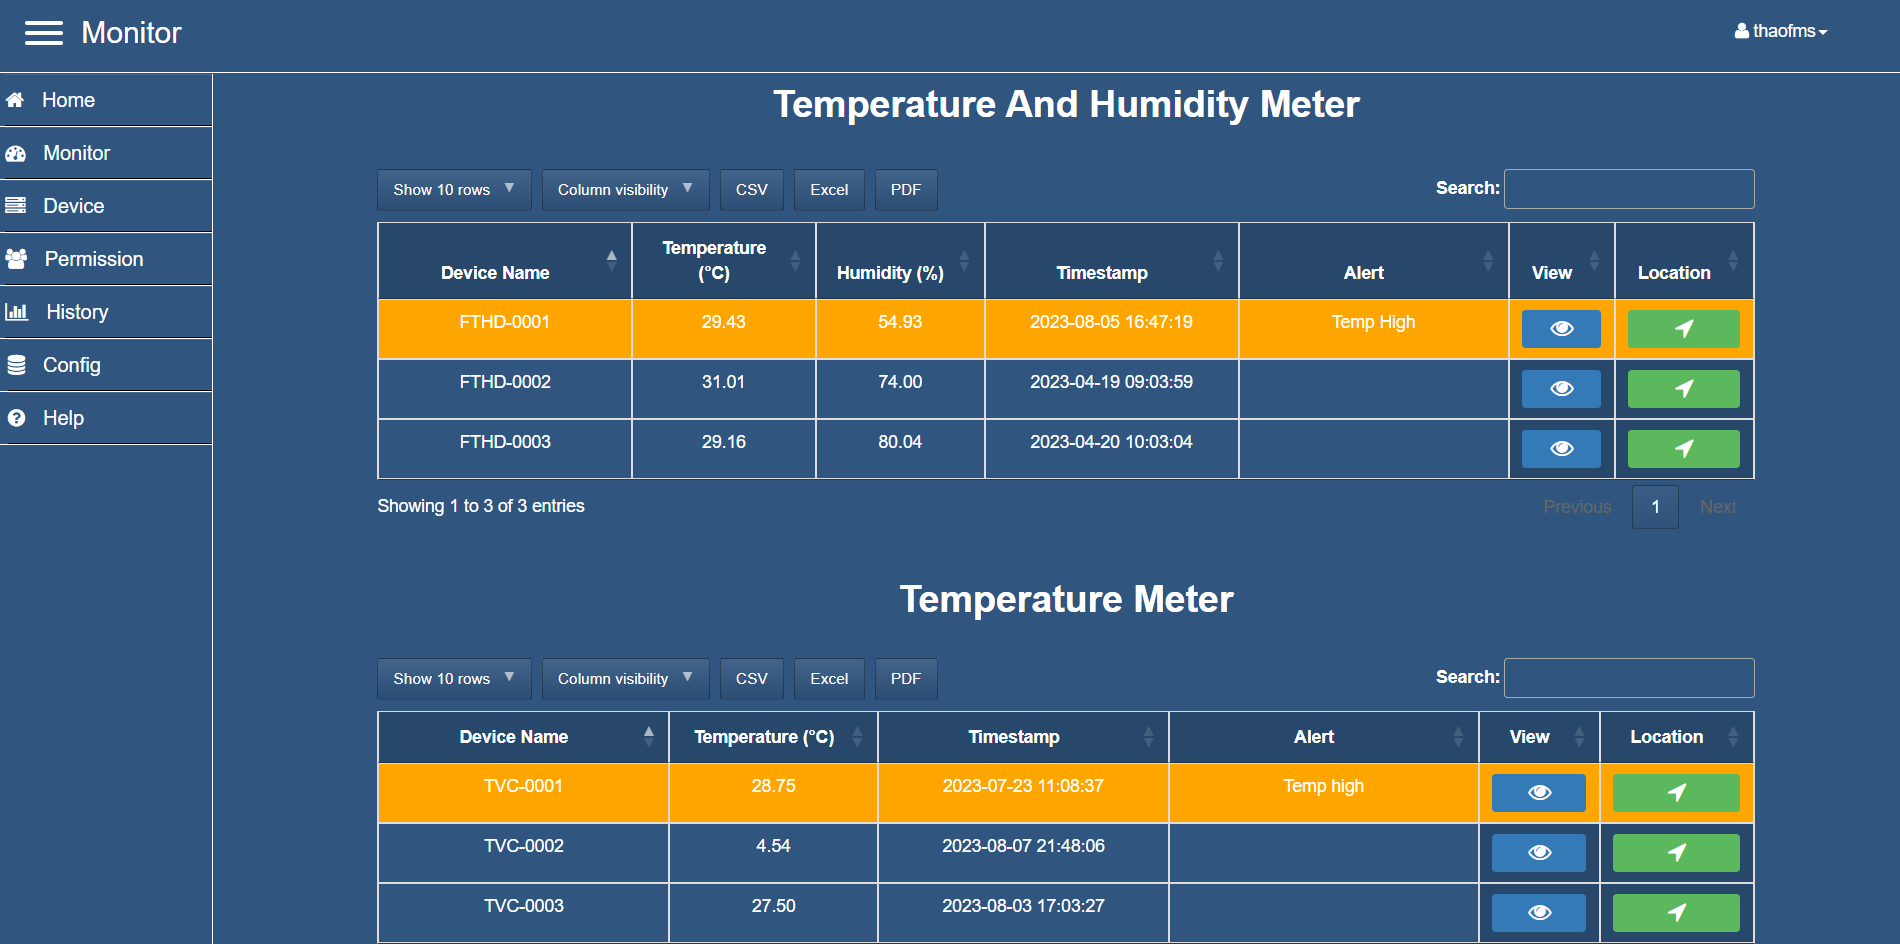
Figure 3.1. Monitoring interface.
The interface has some additional features such as choosing the number of devices displayed on a page of the table, hiding/showing columns on the table, exporting a .csv, .excel, .pdf file a list of monitored devices. Search the device in the monitoring panel.
3.2. Map
The map displays the location of the device based on the coordinates (longitude, latitude) of the device location. The devices on the map show detailed real-time device parameters.
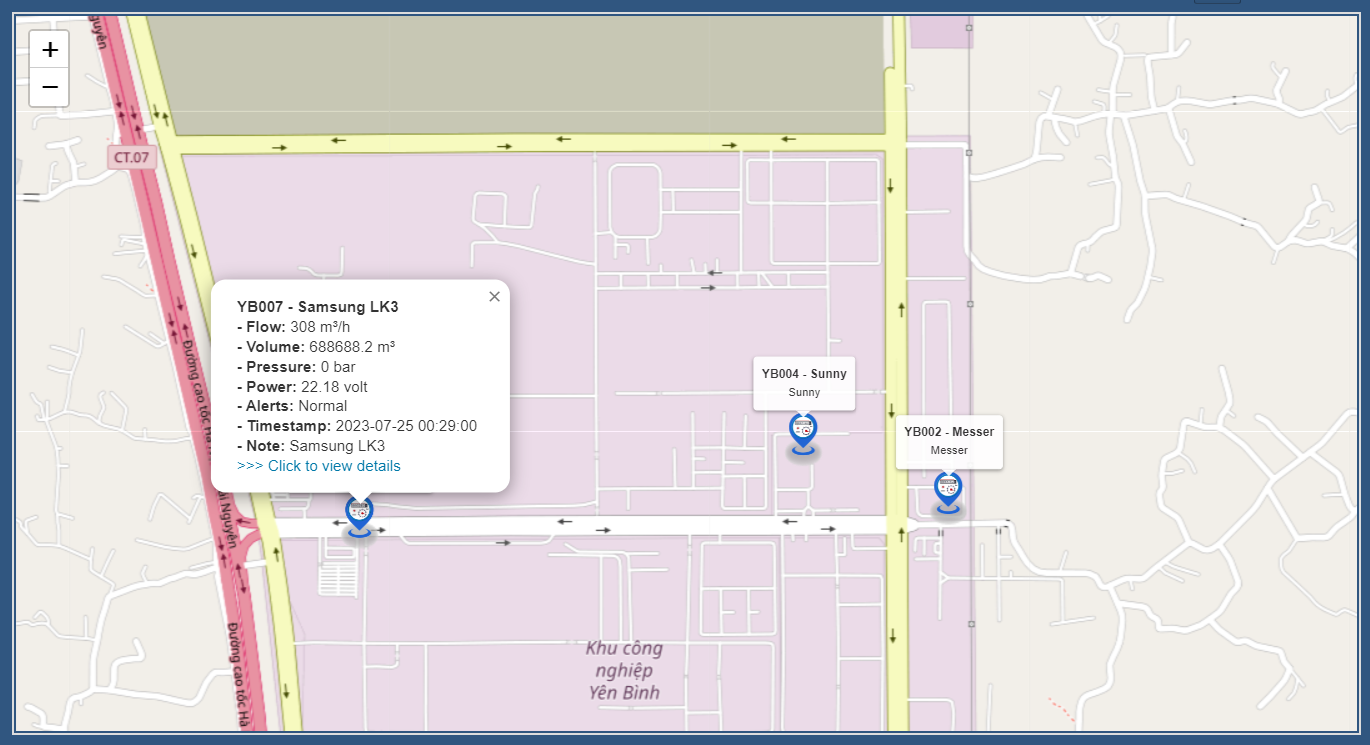
Figure 3.2. Location monitoring map of device.
3.3. Extended features
* Button “View” redirect to watch data detail view page.
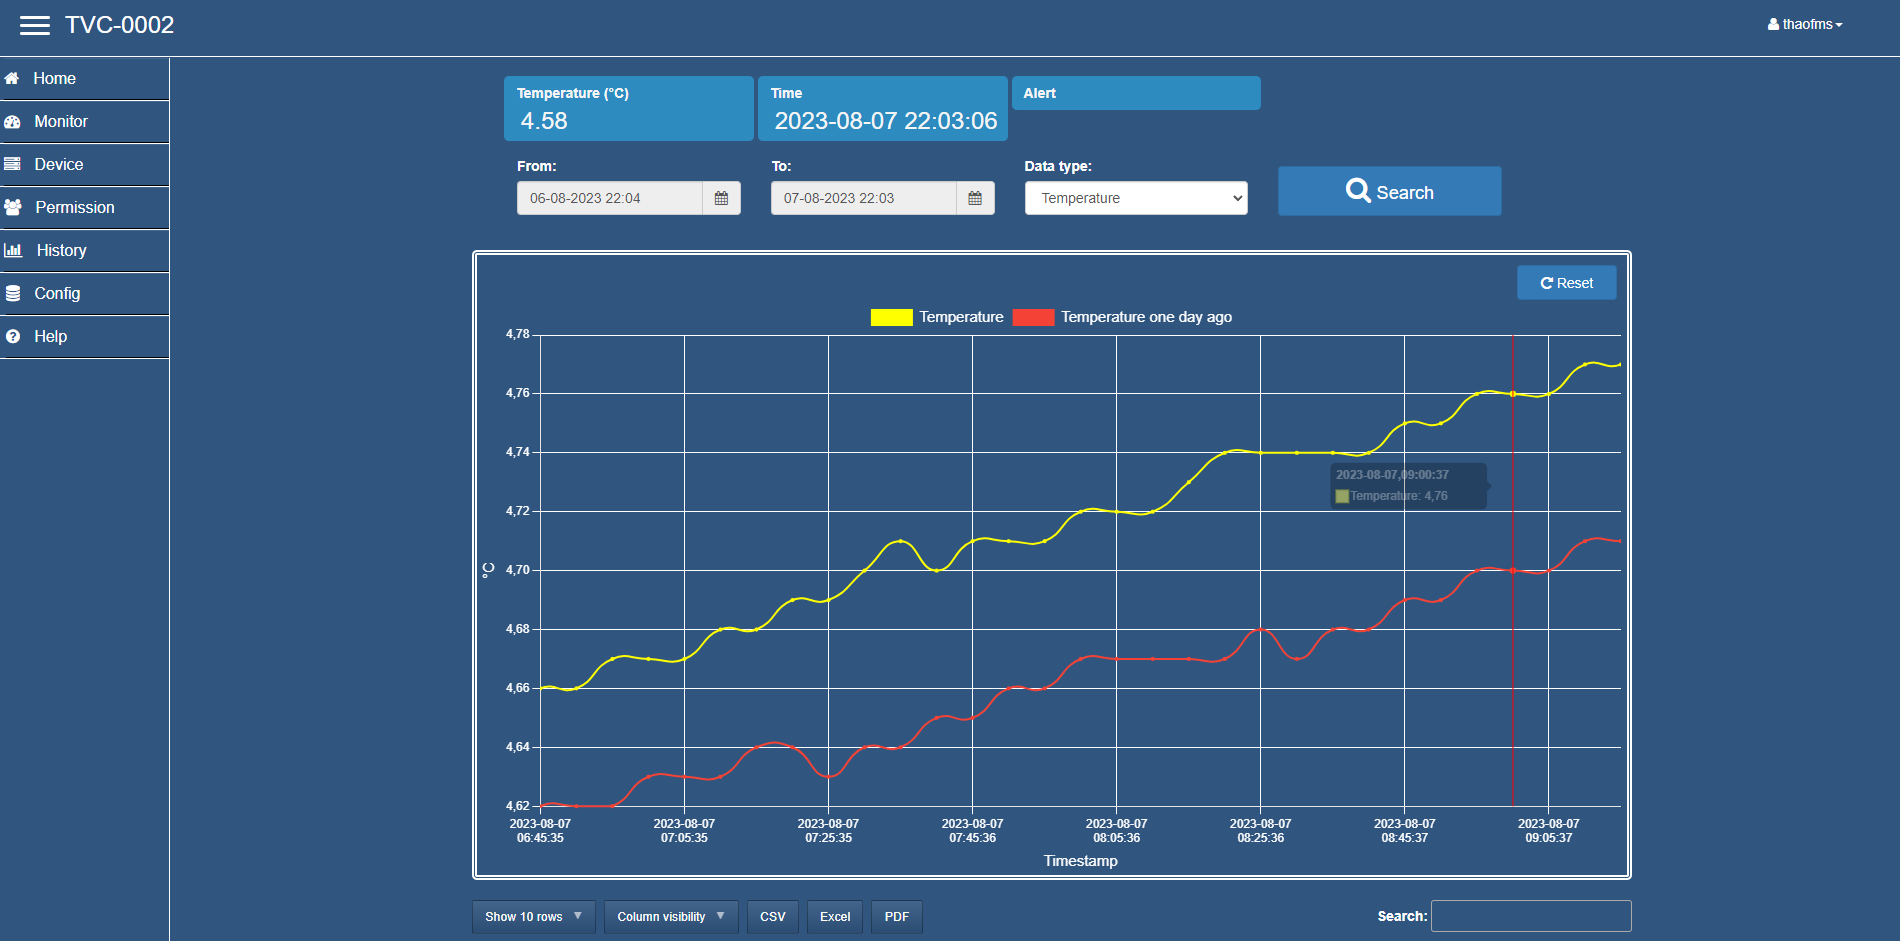
Figure 3.3. Charts over time.
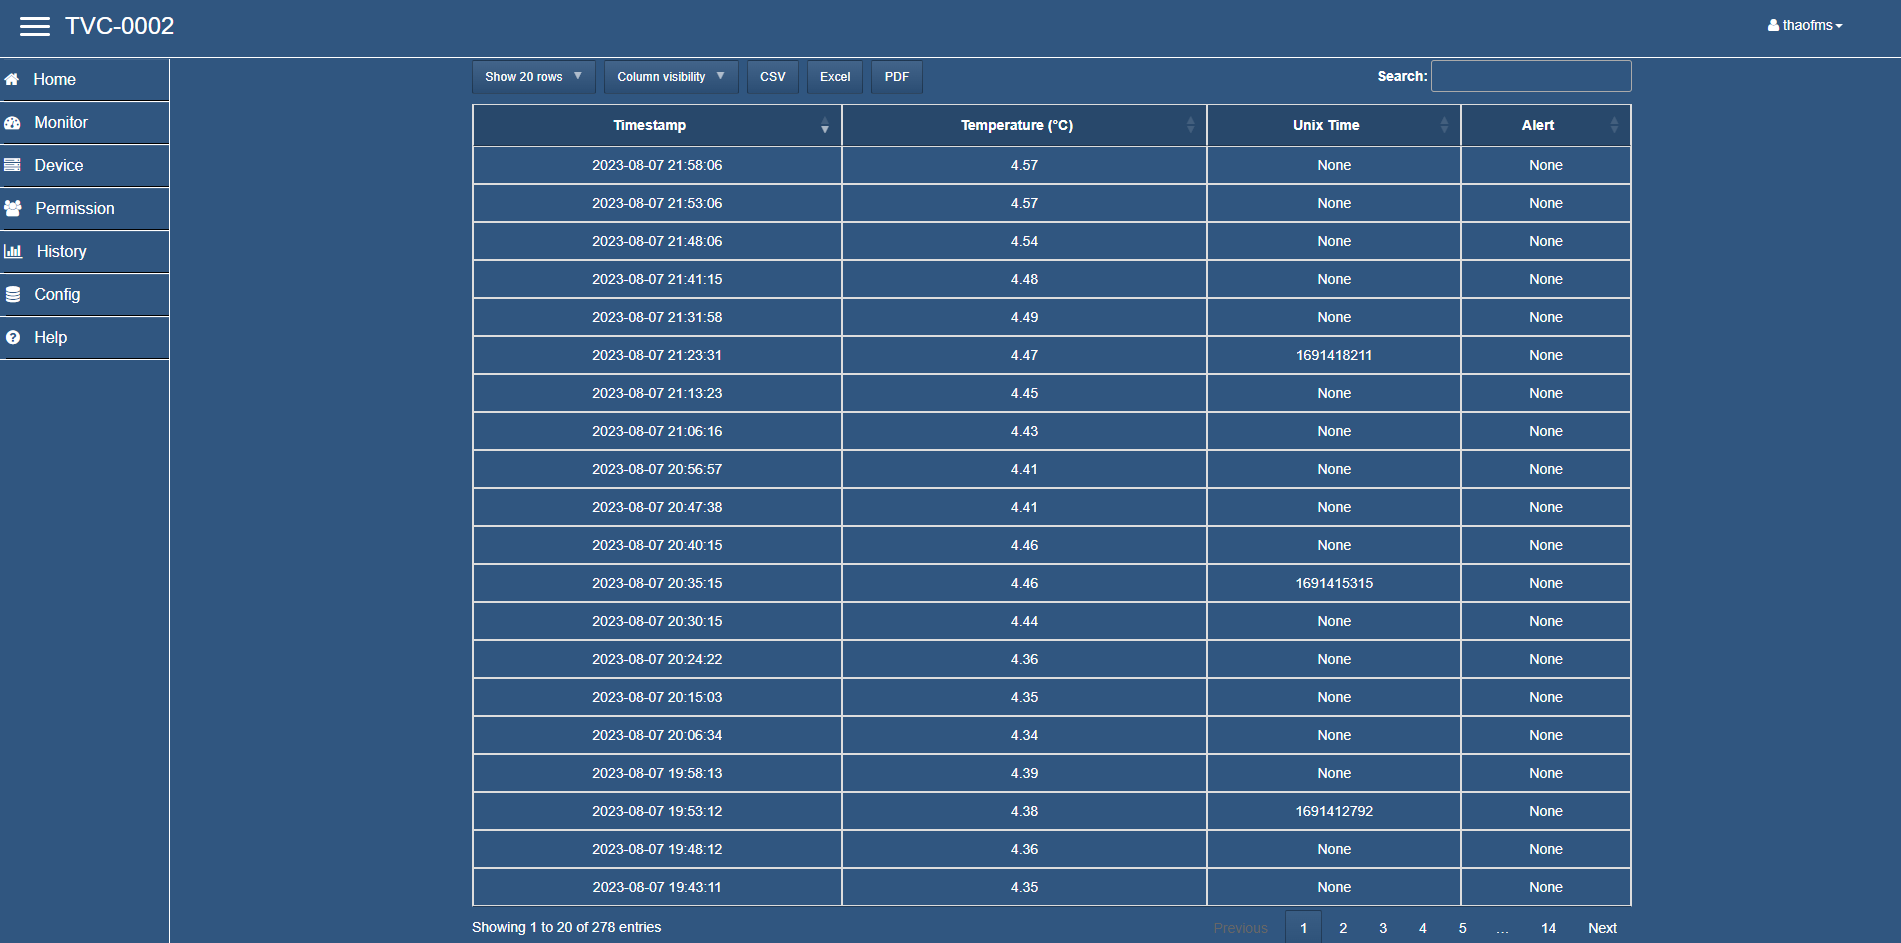
Figure 3.4. Data table over time.
* Button “Location” direct navigation to the location of the device on the map.
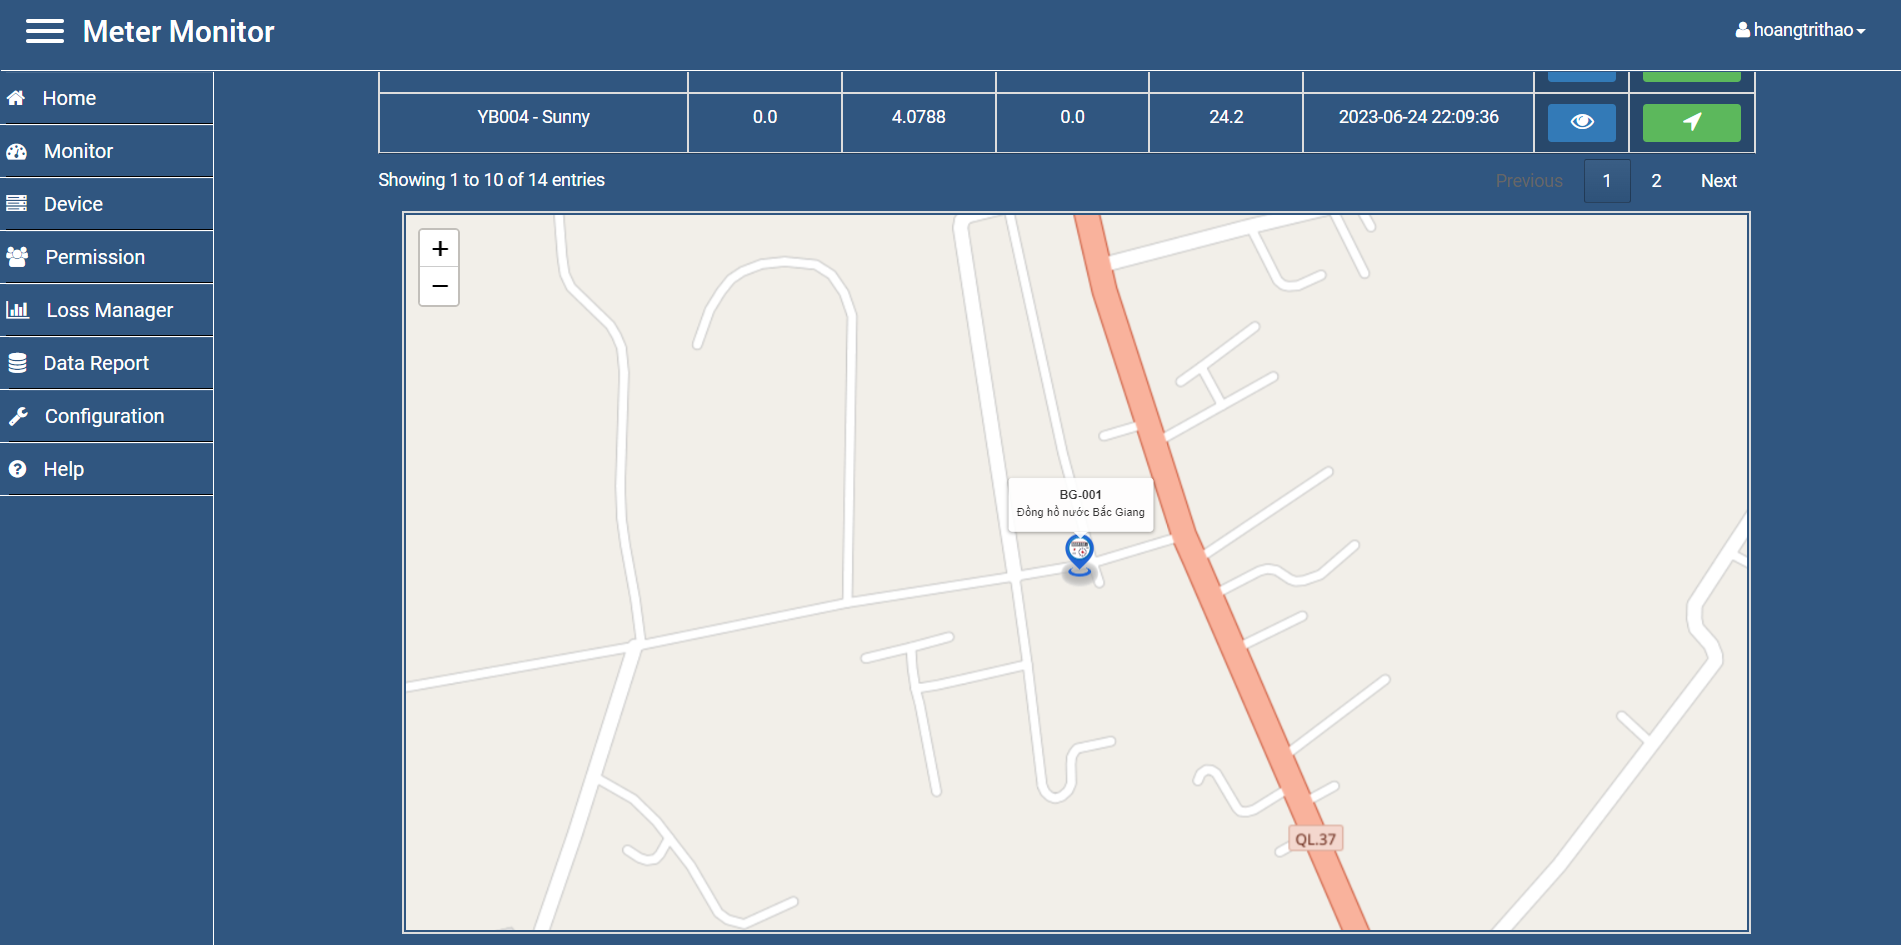
Figure 3.5. Selected device location.
4. Device manager
4.1. Function
- The device management interface allows you to control the list of devices that you are managed.
- At this interface you can add new, setting, change alert mode and delete devices.
- Requires the permission is Admin or higher to setting and delete the device.
- Alert Mode:
- On: If the sensor detects an abnormal state, it will warn once every 5 minutes until it returns to normal.
- Off: Alerts only when device state change is detected.
- Alert method via email, mobile app, SMS (SMS collects usage fee).
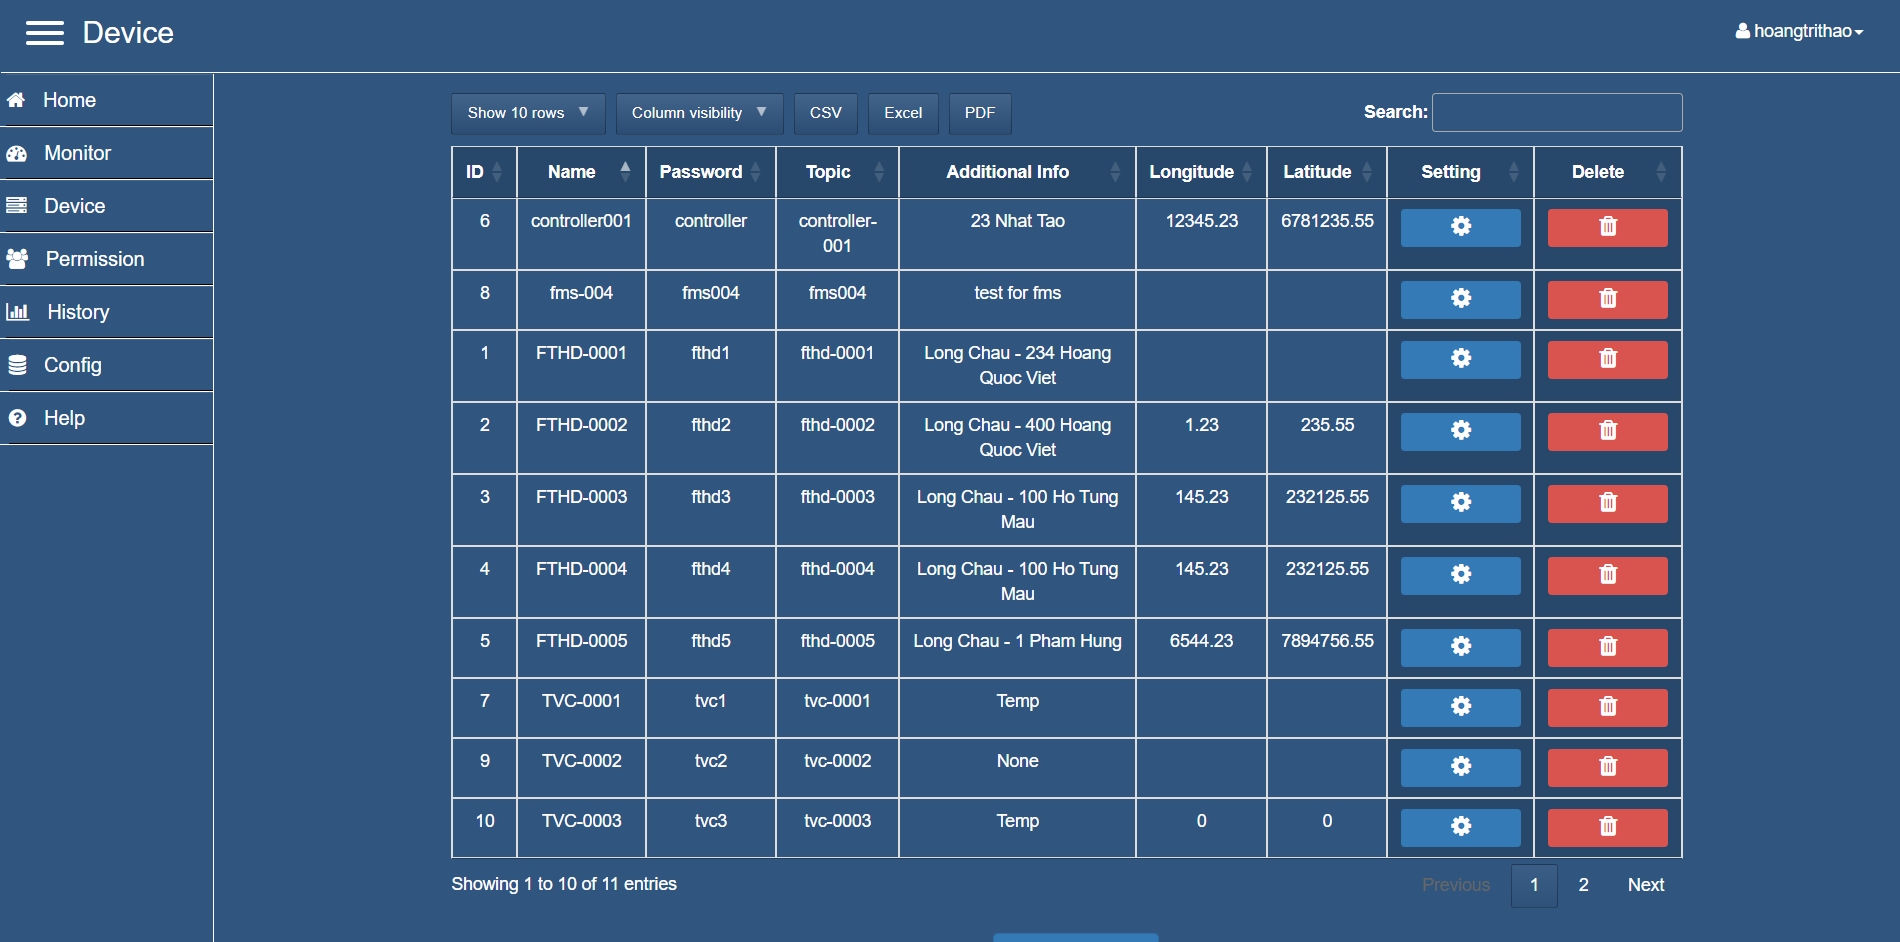
Figure 4.1. Device manager interface.
4.2. Device setting
- Requires the permission is Manager or higher.
- At the device list interface, select “Setting” of the device you want to install. The interface will display a window allowing you to enter the parameters you want to install for the device.
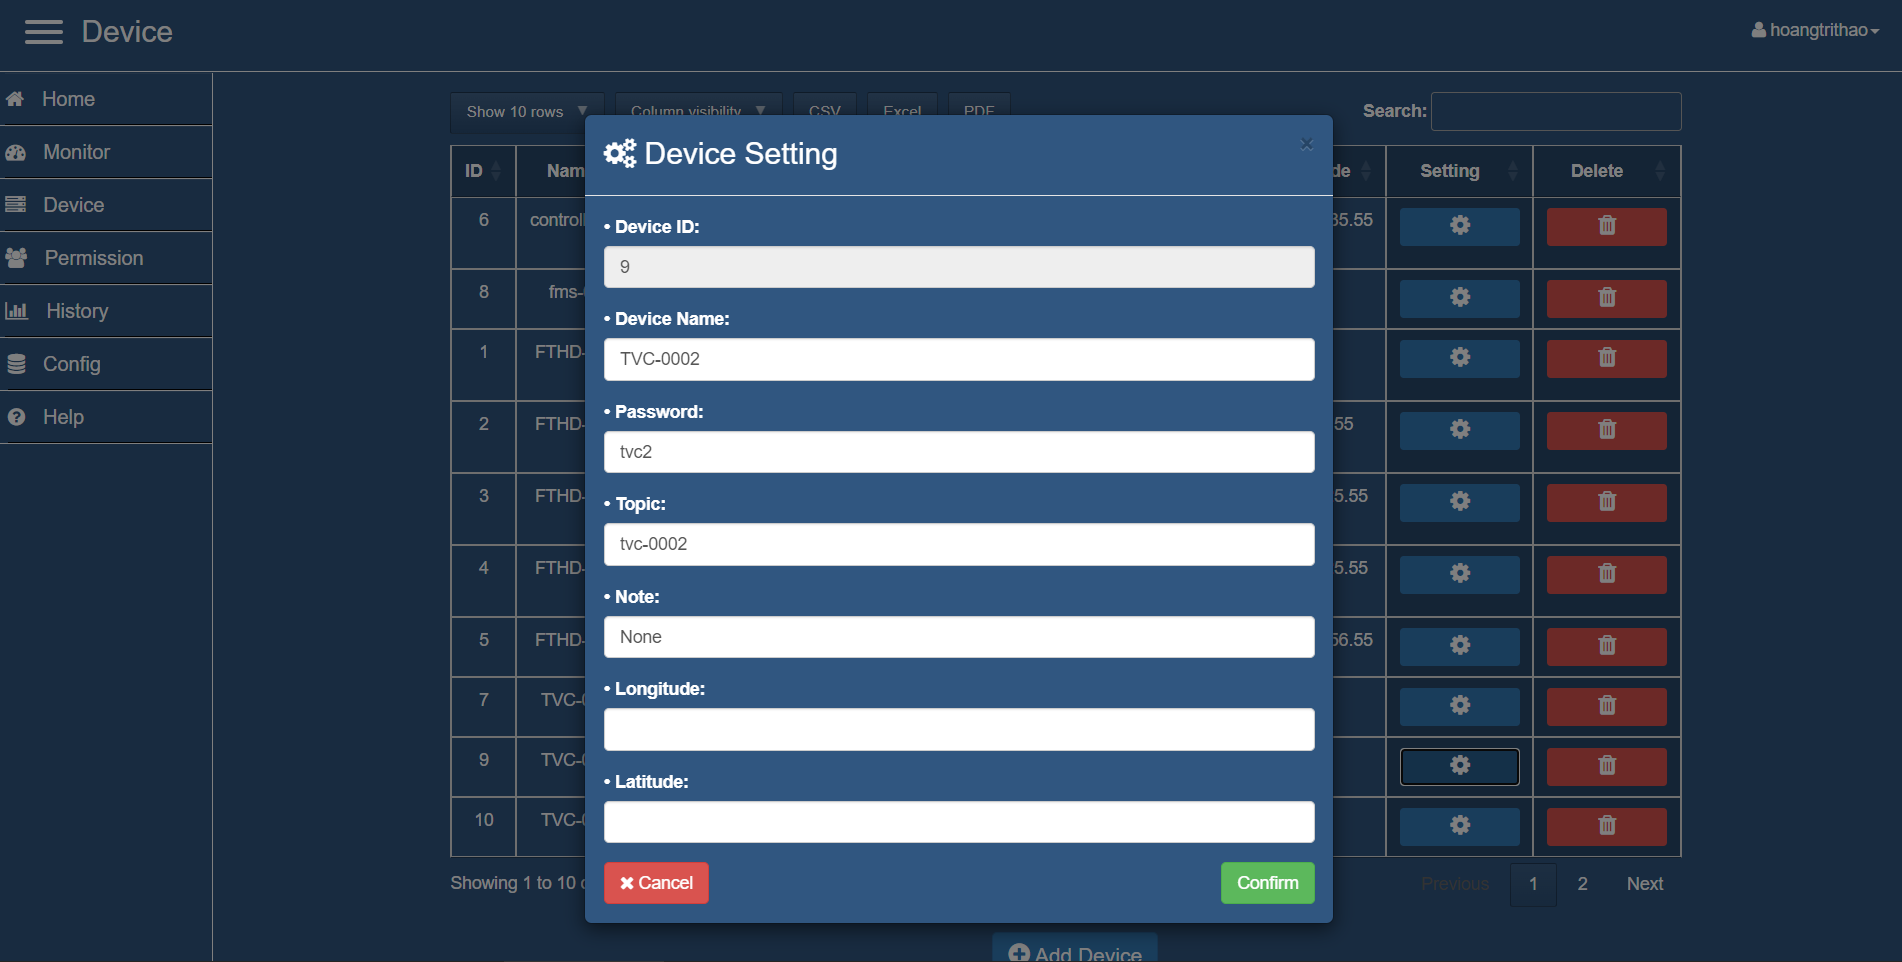
Figure 4.2. Device setting.
5. Permission manager
5.1. Function
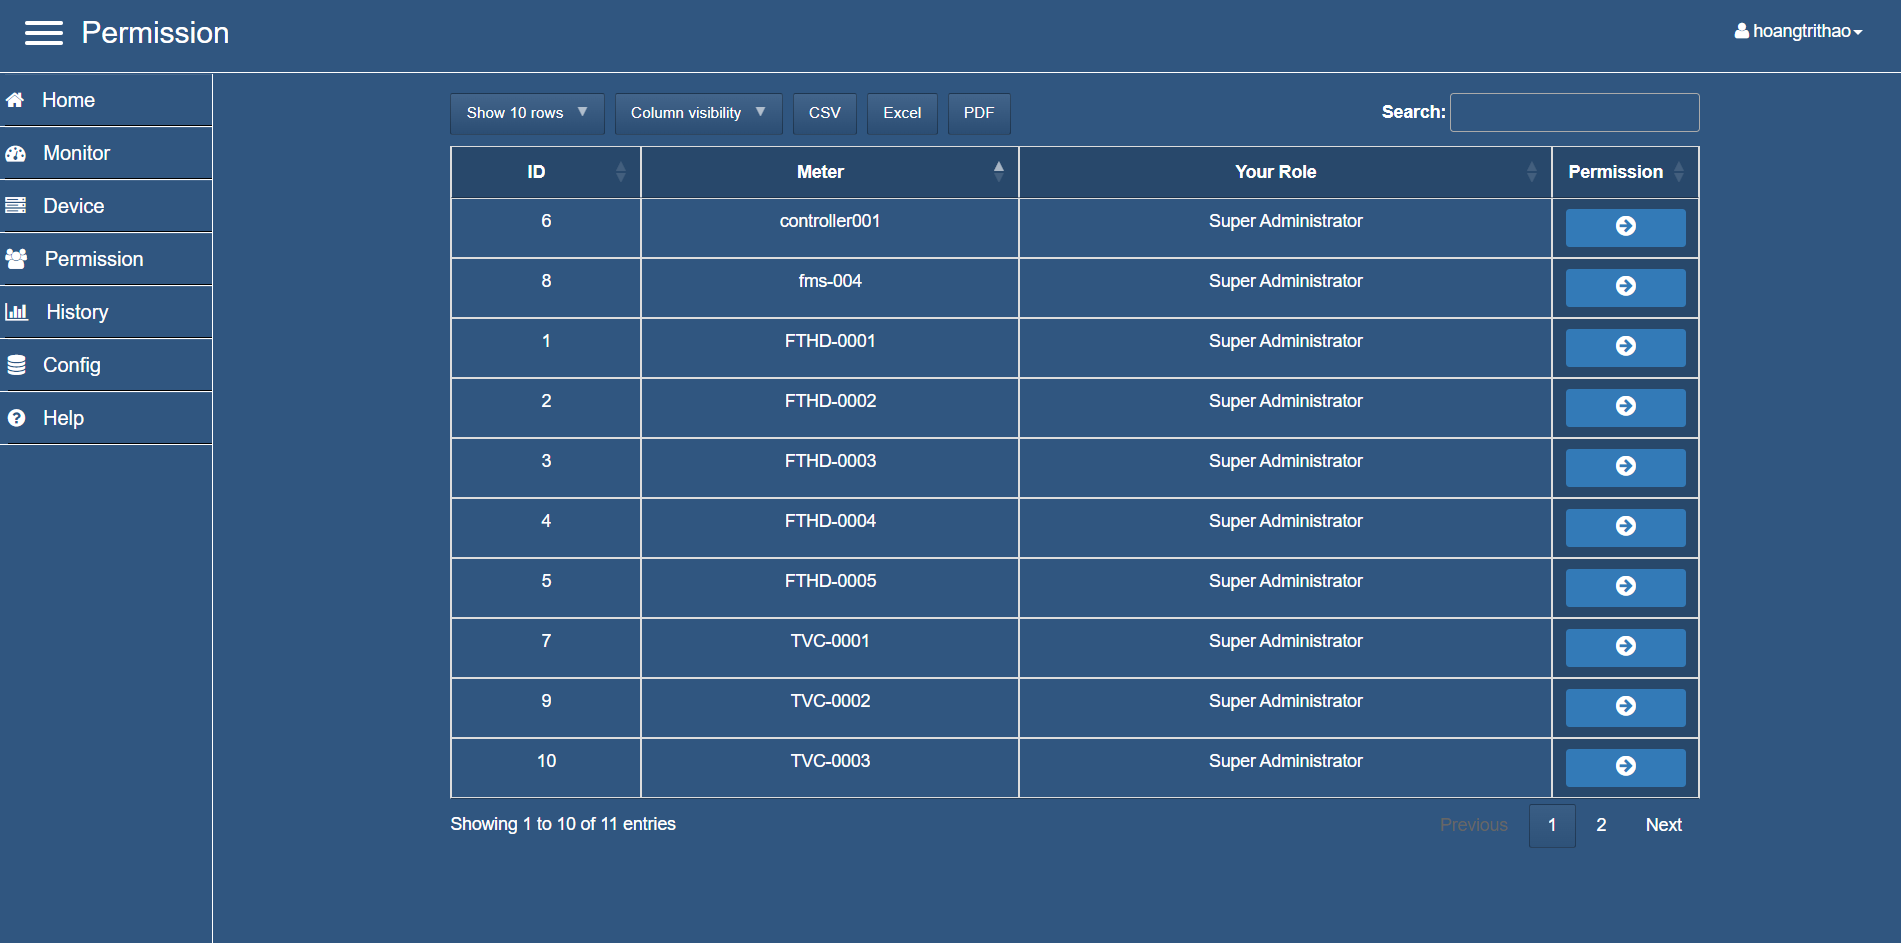
Figure 5.1. Permission manager interface.
5.2. Device permission
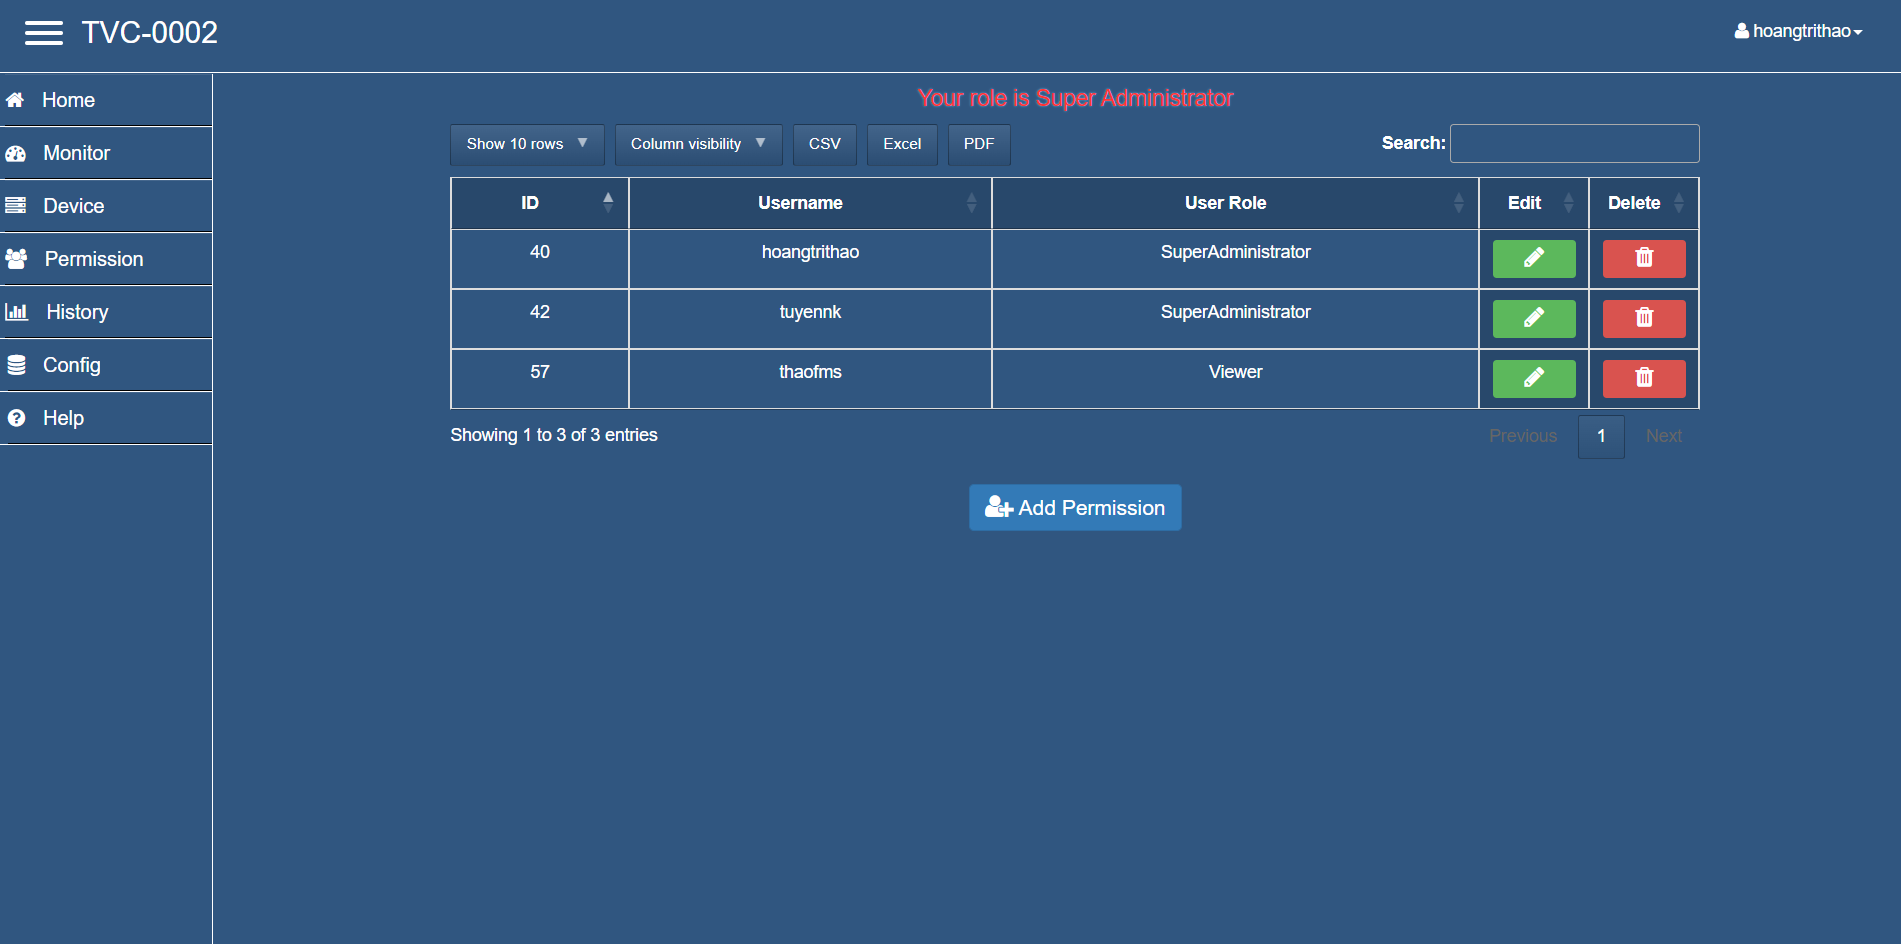
Figure 5.2. Device permission interface.
- Requires the position of Manager or higher.
- The decentralized management interface allows you to see a list of devices that you are authorized to monitor.
- Export the list of devices that are authorized to manage to excel, csv, pdf files.
- Click “Permission” to enter the decentralized interface of each device.
At this interface there are features:
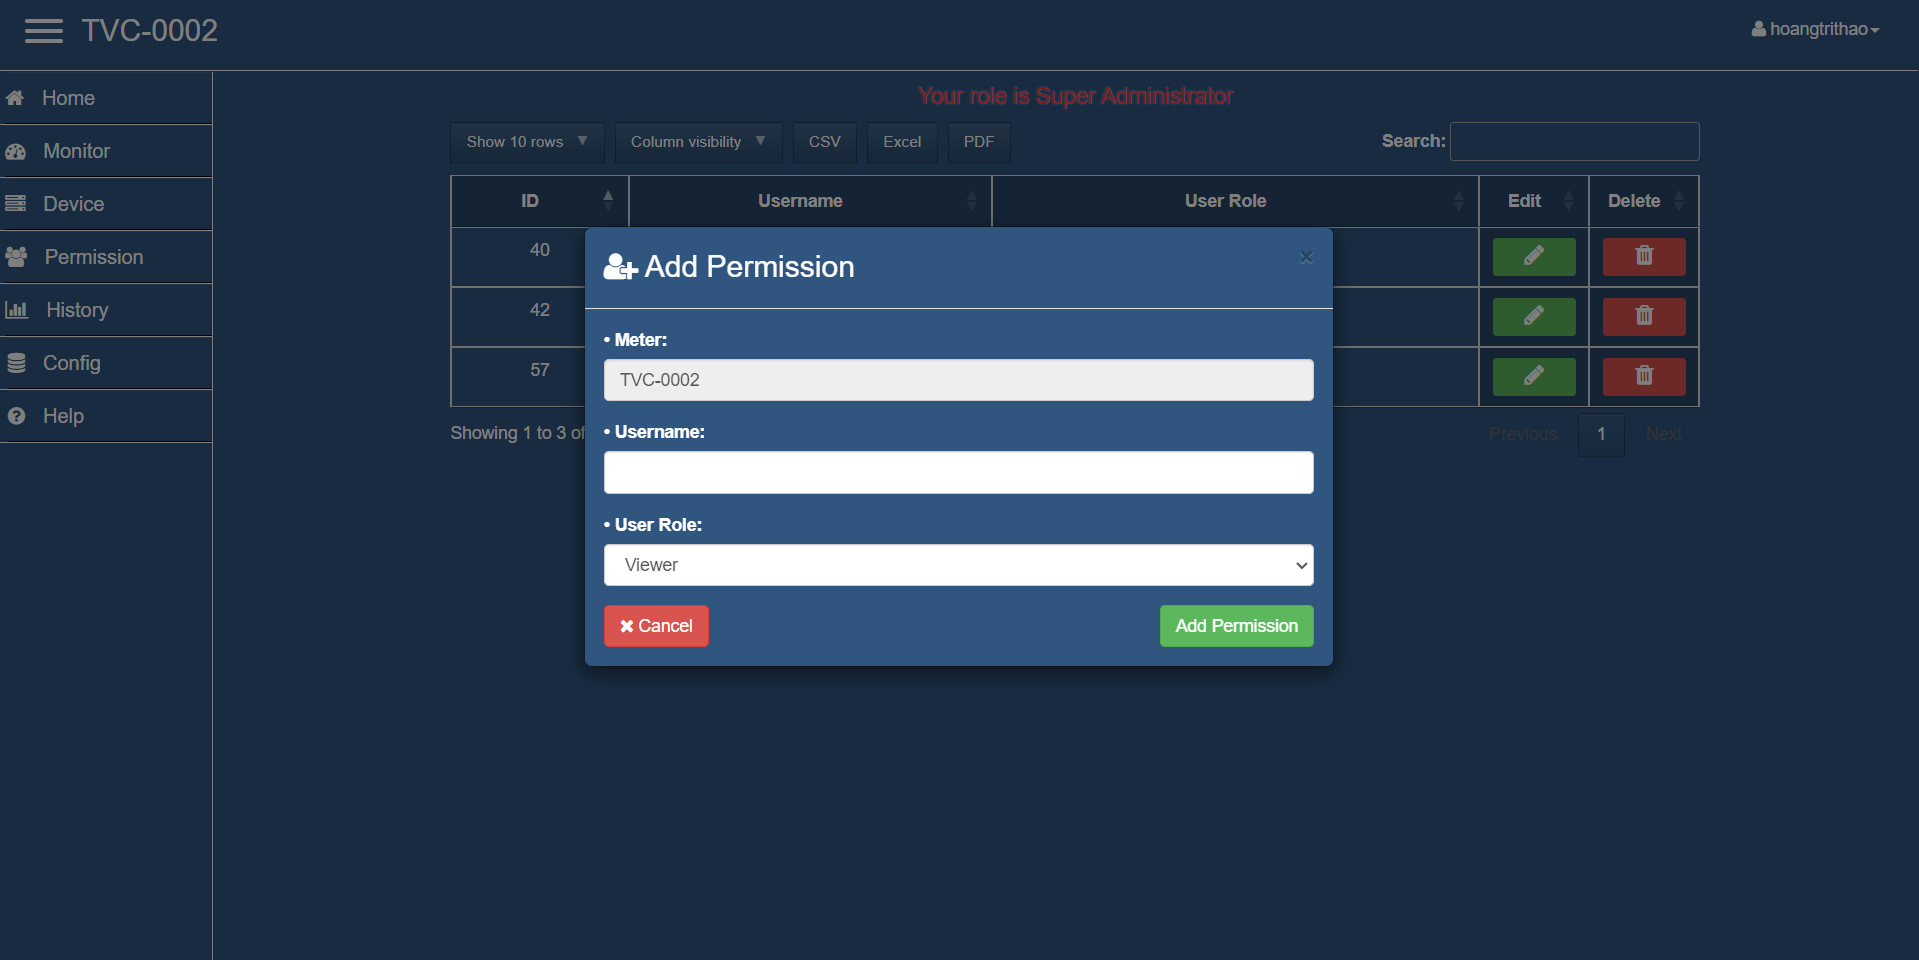
Figure 5.3. Add new permission.
Click “Add Permission”, the interface will display a window to enter permission information. Here you enter the user name and choose to assign the role to that user.
Note: you can only grant a role lower than your current role to other users.
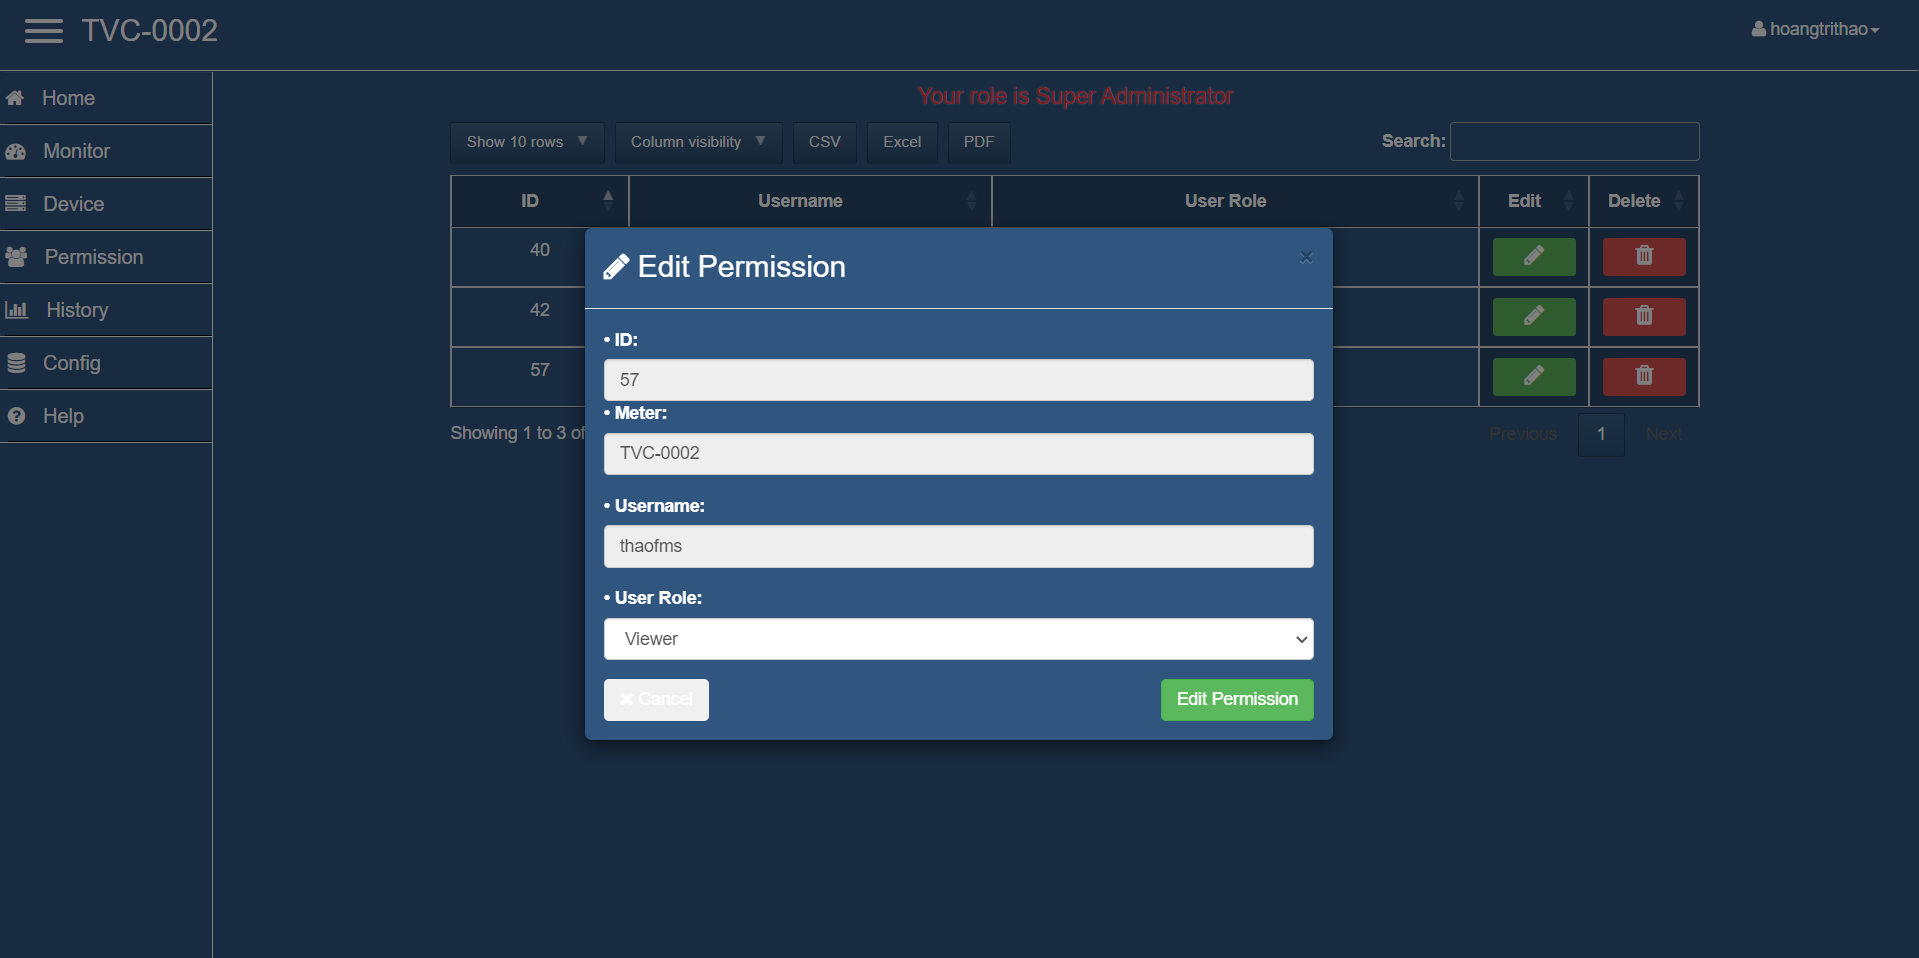
Figire 5.4. Edit permission.
Click “Edit” of permission to edit. The interface will display a window that allows you to edit the permission information.
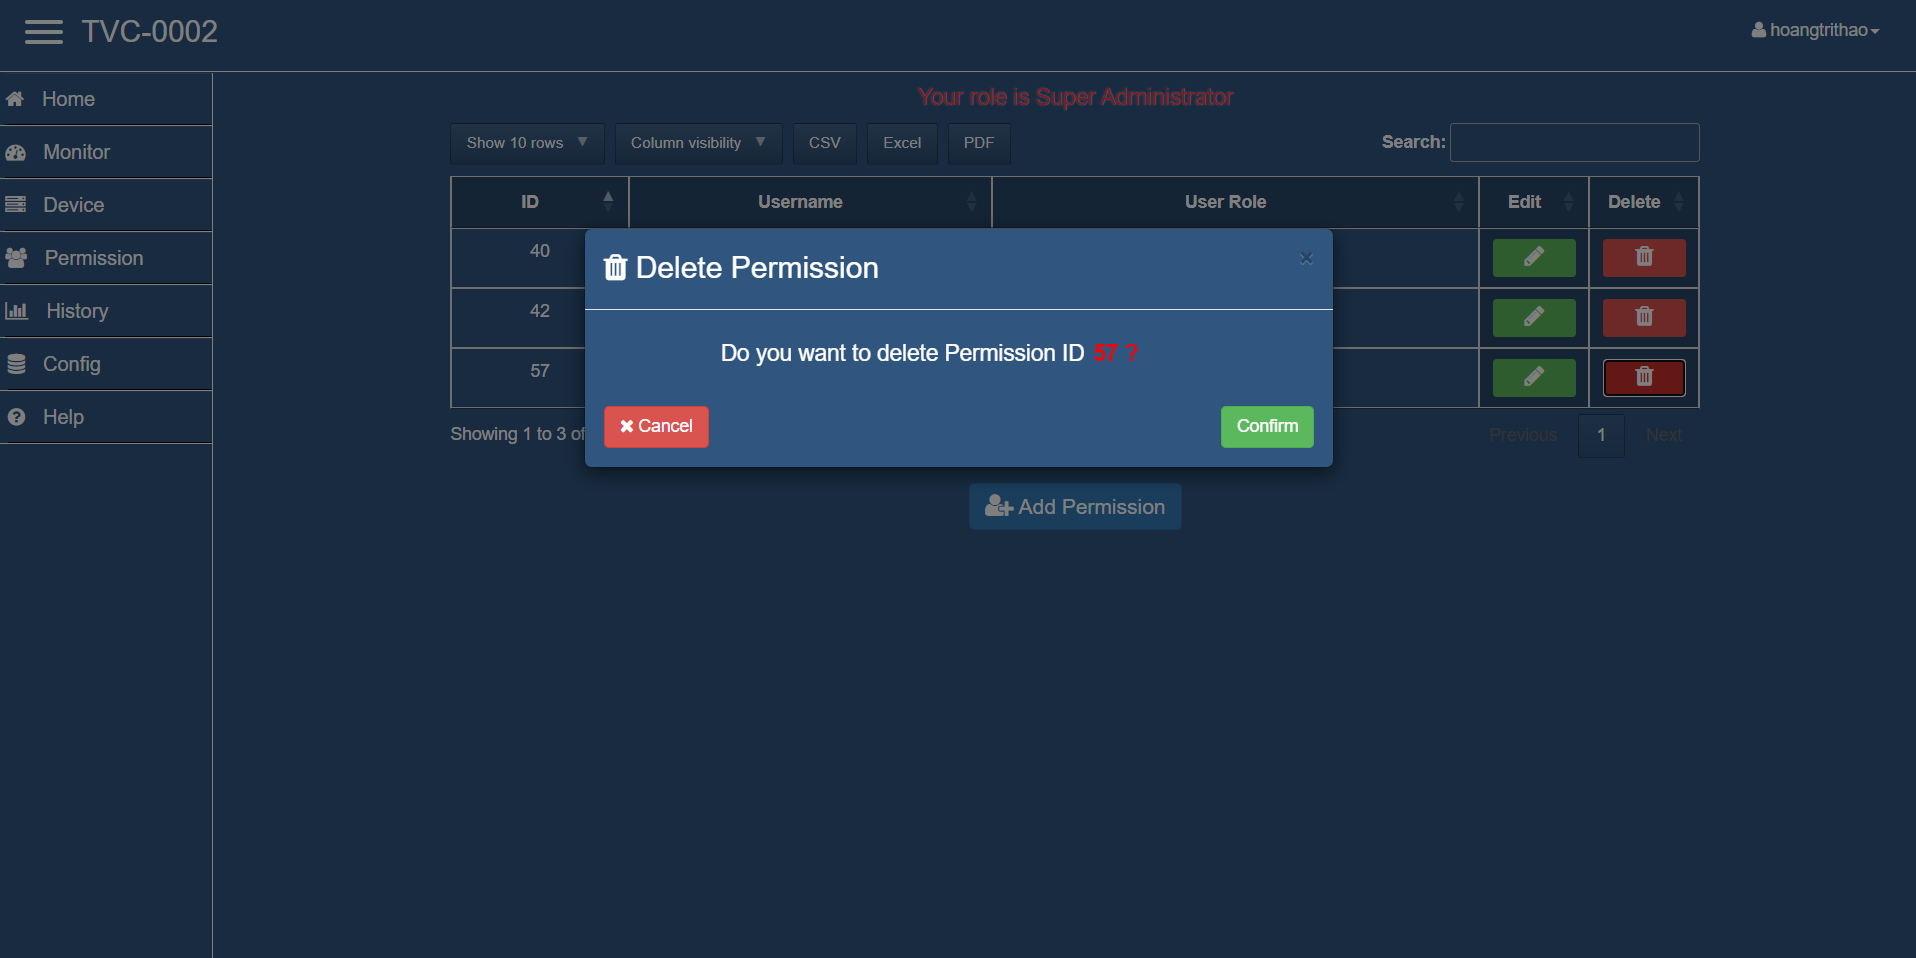
Figure 5.5. Delete permission.
At the permission interface, you choose “Delete” of the permission you want to delete, then click “Confirm” to delete that permission.
6. Data history
6.1. Function
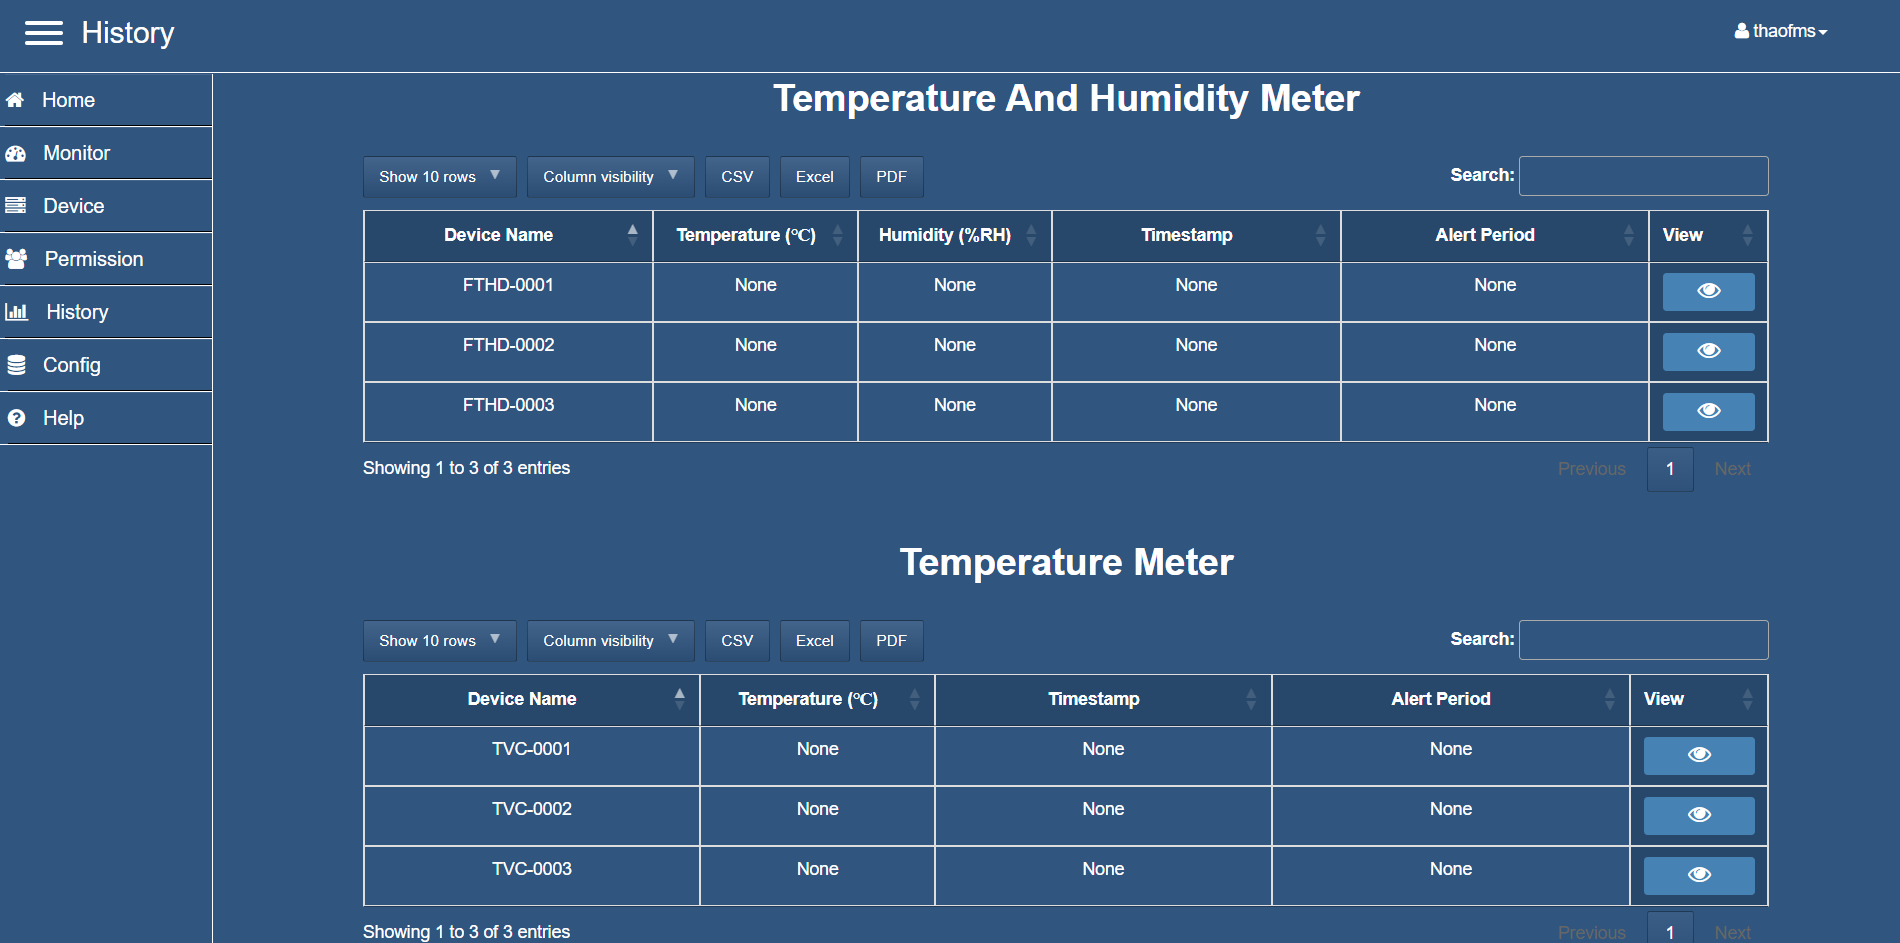
Figure 6.1. Data history.
- The interface allows users to access records stored on the device. Every 30 minutes there will be a history log.
- Export data history as excel, csv, pdf files.
6.2. Details of device history
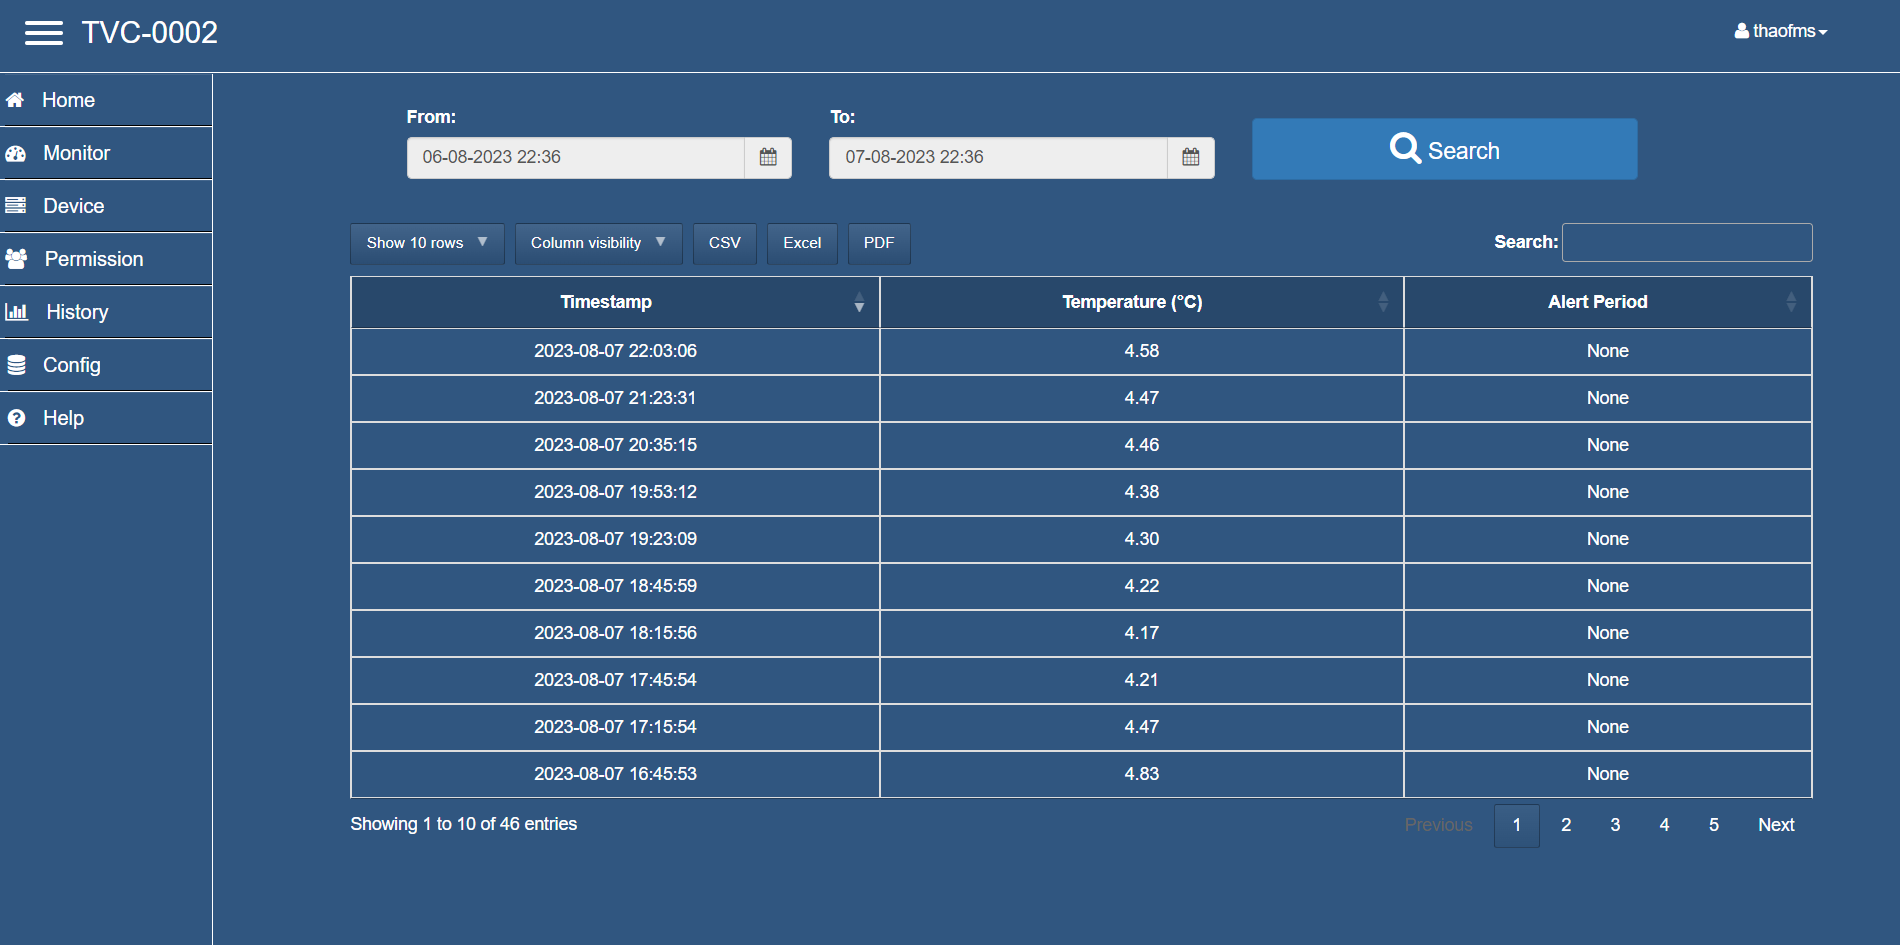
Figure 6.2. Details of the device's save history.
- Step 1: Select the time period you want to get the data report.
- Step 2: Click “Search”. The system will calculate and return a report of the volume of water consumed during the selected period.
7. Device configuration
7.1. Function
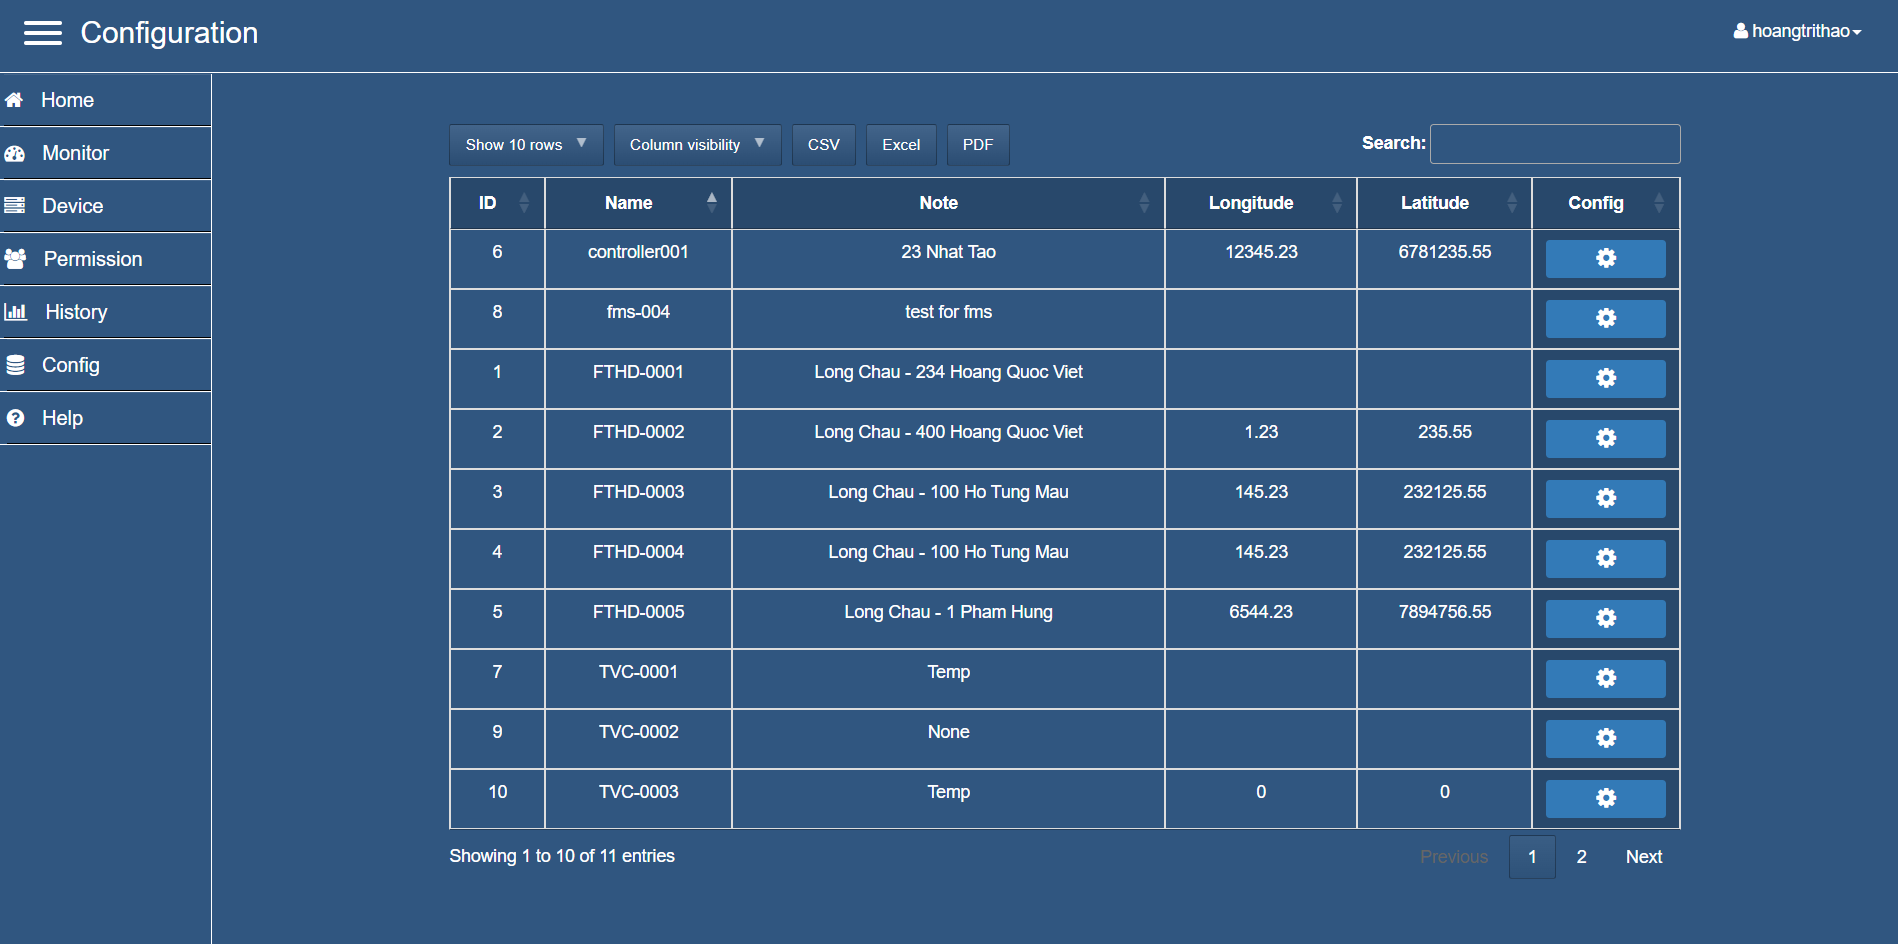
Figure 7.1. Device configuration.
- Requires the permission is Admin or higher.
- The interface displays all the devices that you are authorized to manage. You can select the “Config” of the device to remotely configure the parameters for that device by Get/Set parameters to the device.
7.2. Remote configuration
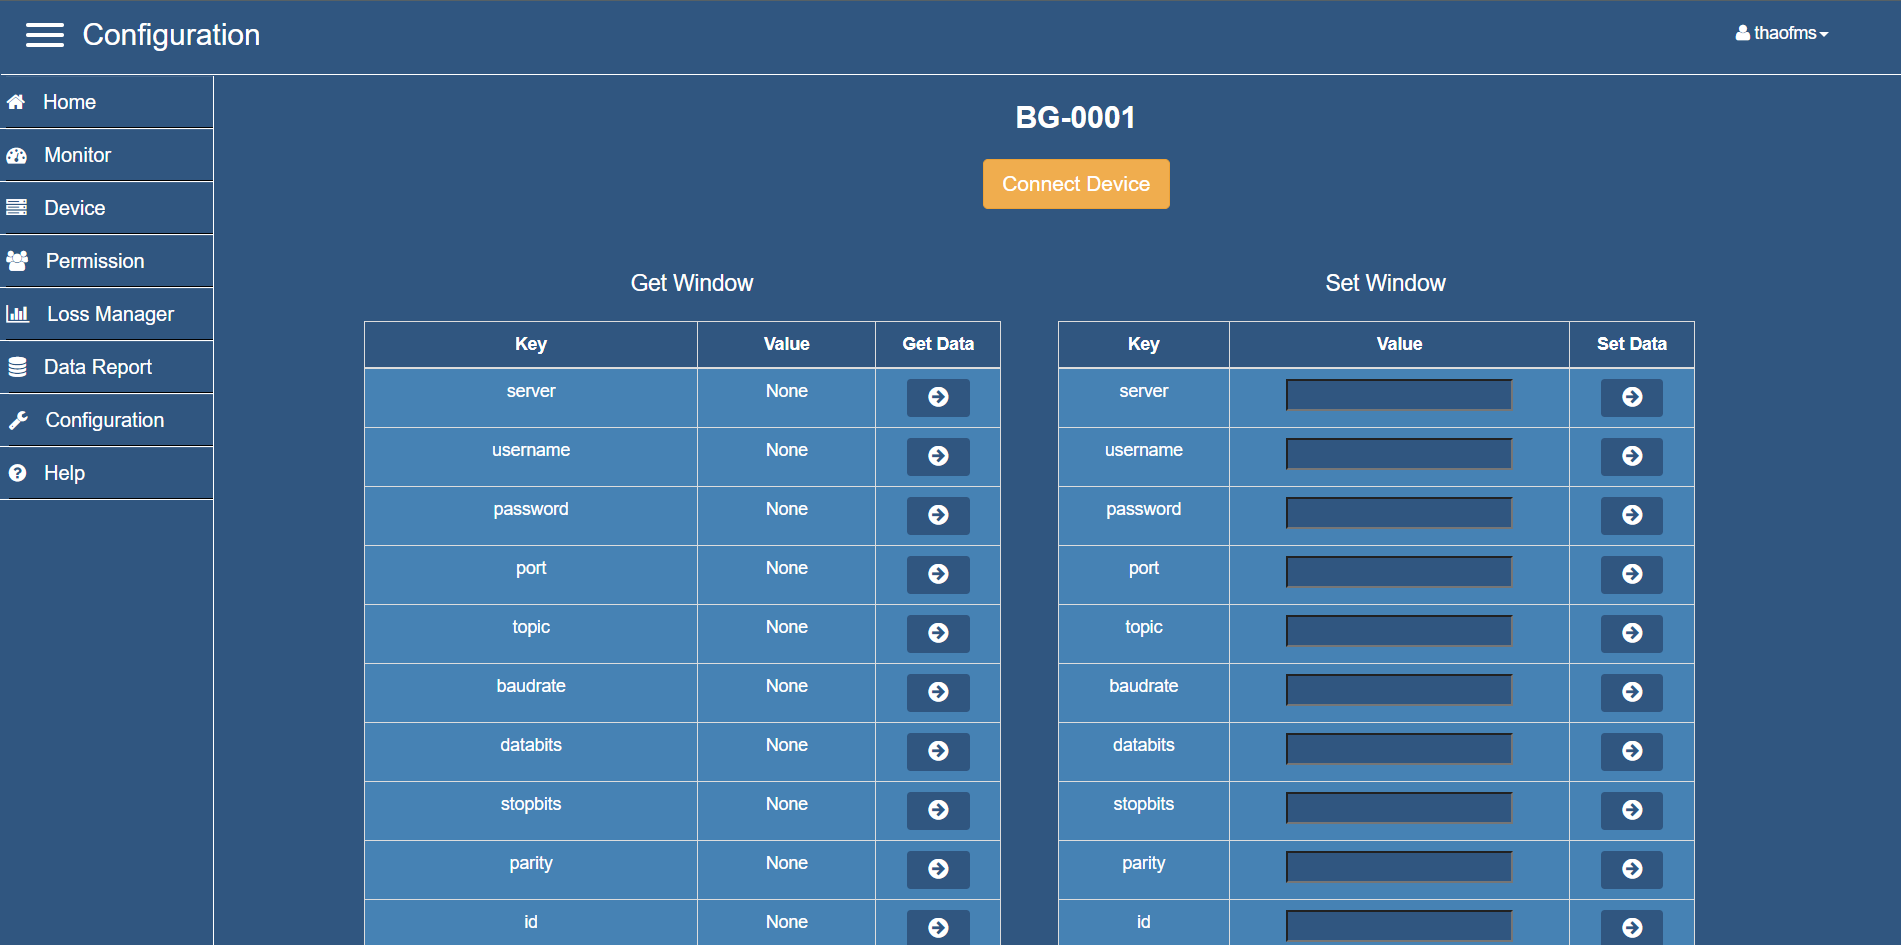
Figure 7.2. Select device to config.
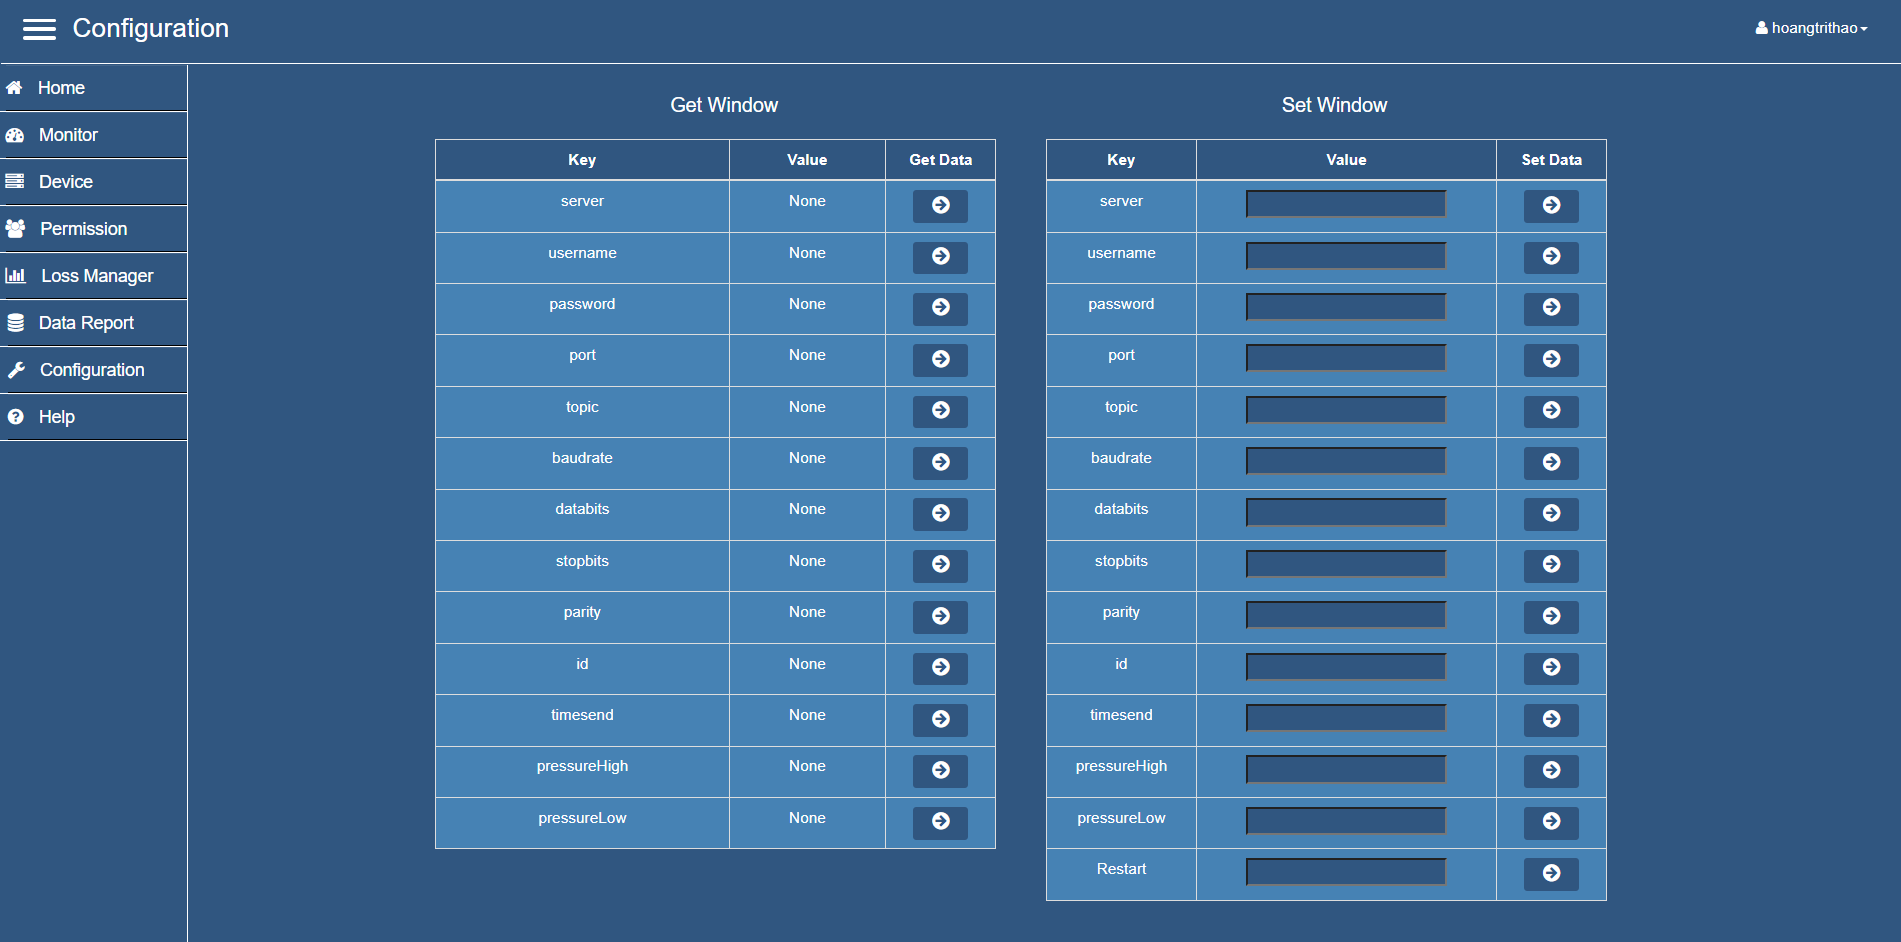
Figure 7.3. Connect to device.
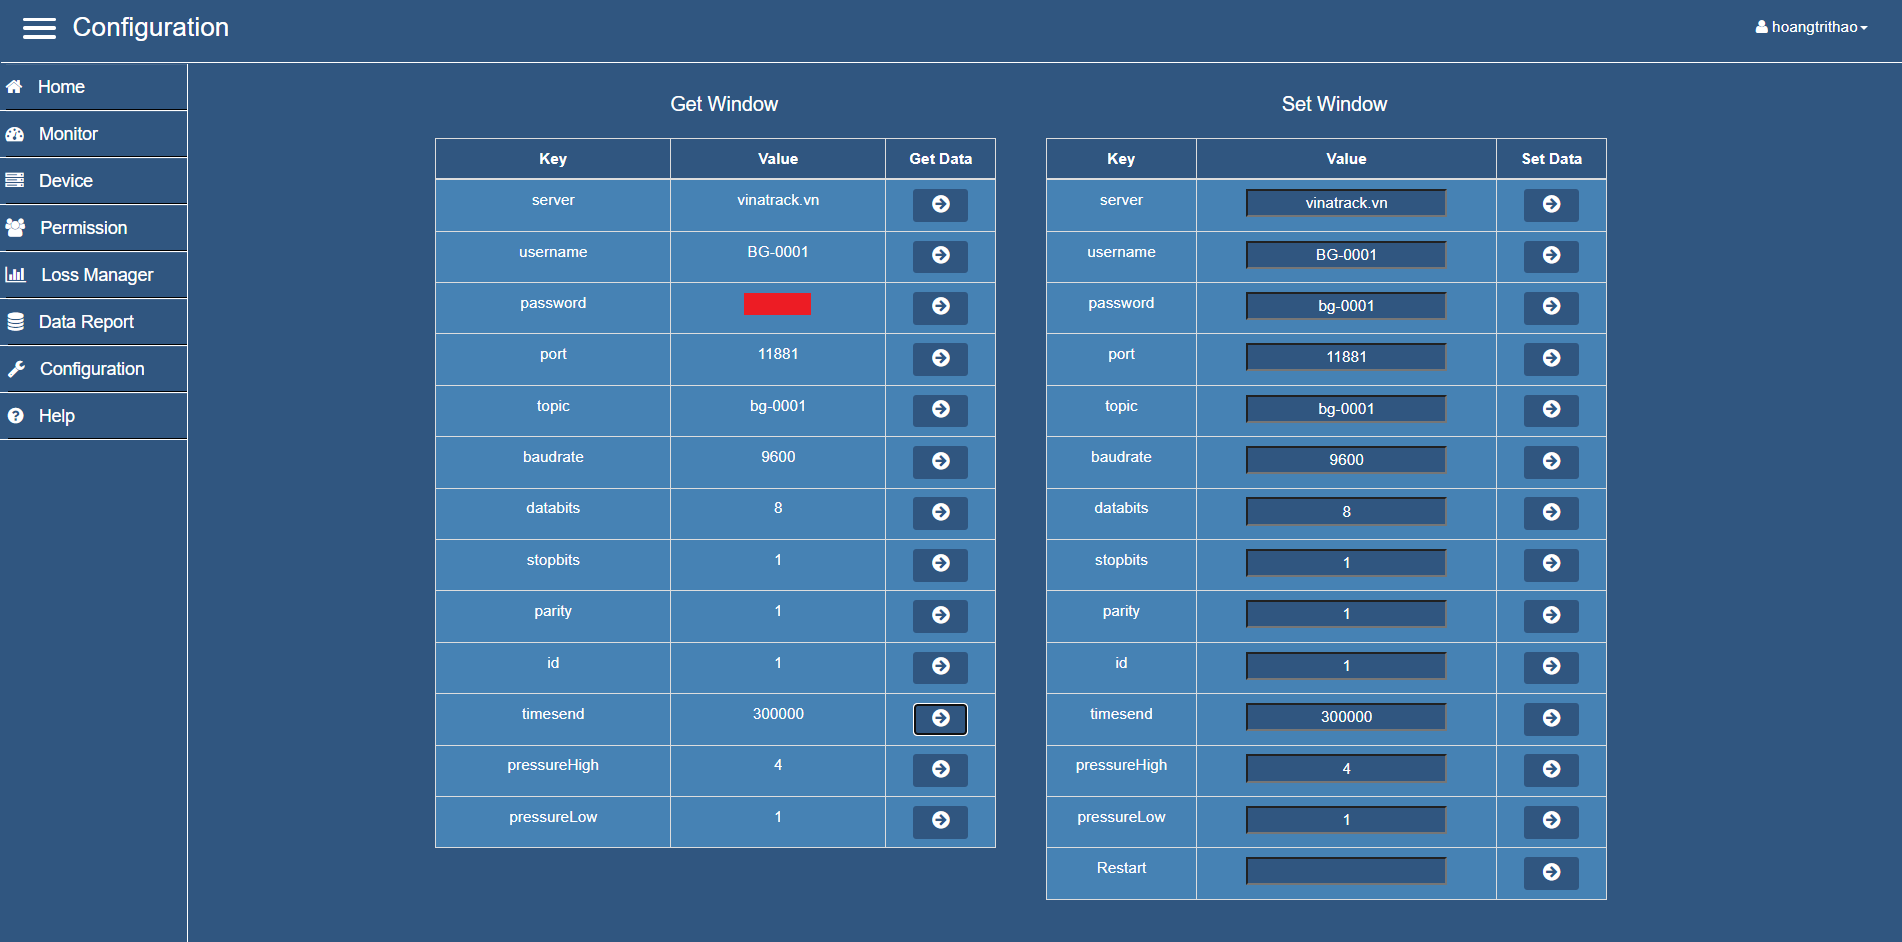
Figure 7.4. Read and write parameters to device.
9. Contact us
- Technical Support:
- E-mail: support@fms.com.vn
- Phone: (+84) 967 893 394
- Purchase:
- E-mail: sales@fms.com.vn
- Phone: (+84) 912 523 895